Farm Drainage Problems? Micro-Topography Is the Hidden Cause
March 25, 2026
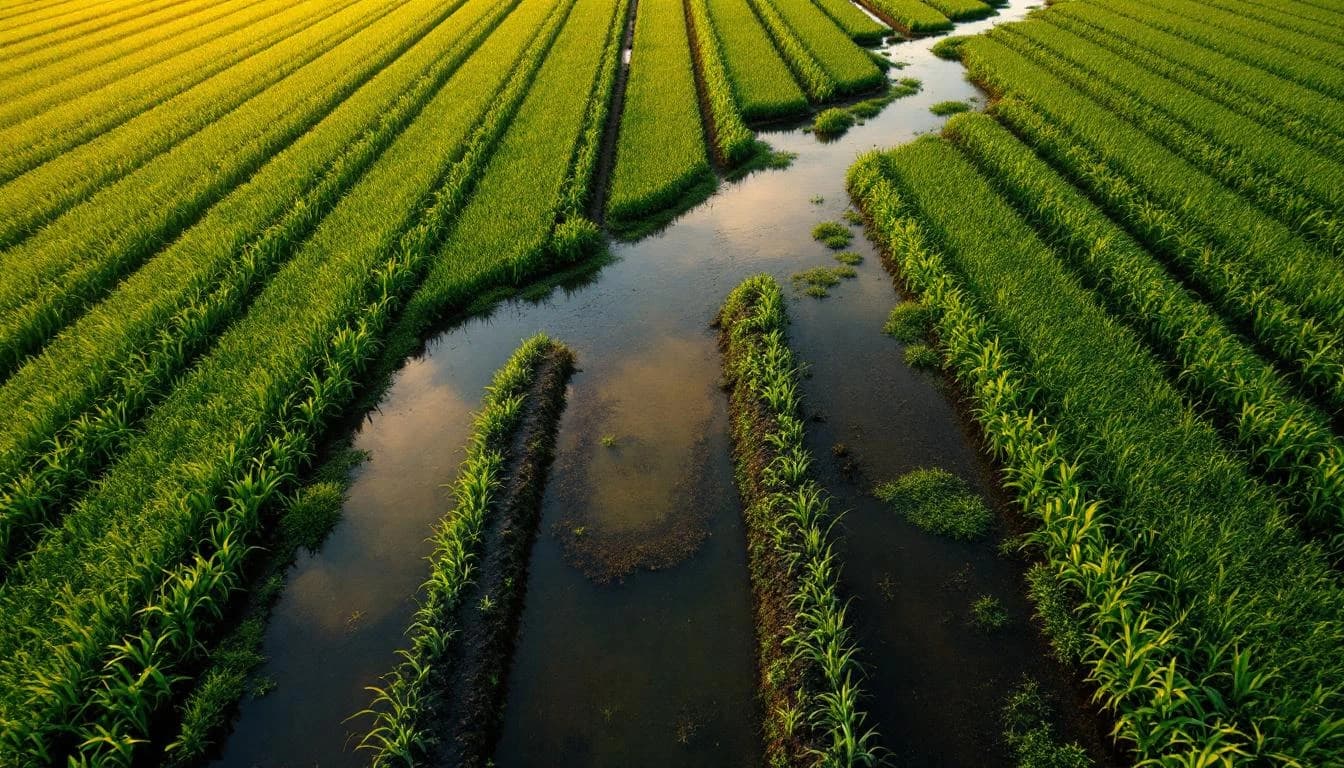
Every growing season, thousands of farmers watch the same frustrating pattern repeat: certain rows drown while others stay parched. Yields drop in patches that seem random. Standing water lingers for days after a storm in one corner of a field while another corner sheds every drop before the soil can absorb it.
Most farmers attribute this to soil variation or bad luck. The real cause is something far more specific and far more fixable — micro-topography.
What Is Micro-Topography and Why Does It Matter?
Micro-topography refers to small-scale elevation differences across a landscape — changes of just 5 to 15 centimeters that are completely invisible to the naked eye. You can walk across a field and never feel the subtle undulations beneath your feet. But water feels every single one of them.
These tiny elevation changes determine where water flows, where it pools, where it infiltrates, and where it runs off. A depression just 10 centimeters deep across a 50-meter stretch of field creates a collection basin that traps water after every rain event. Research from the USDA Natural Resources Conservation Service consistently identifies poor surface drainage as one of the leading causes of preventable crop loss in the United States.
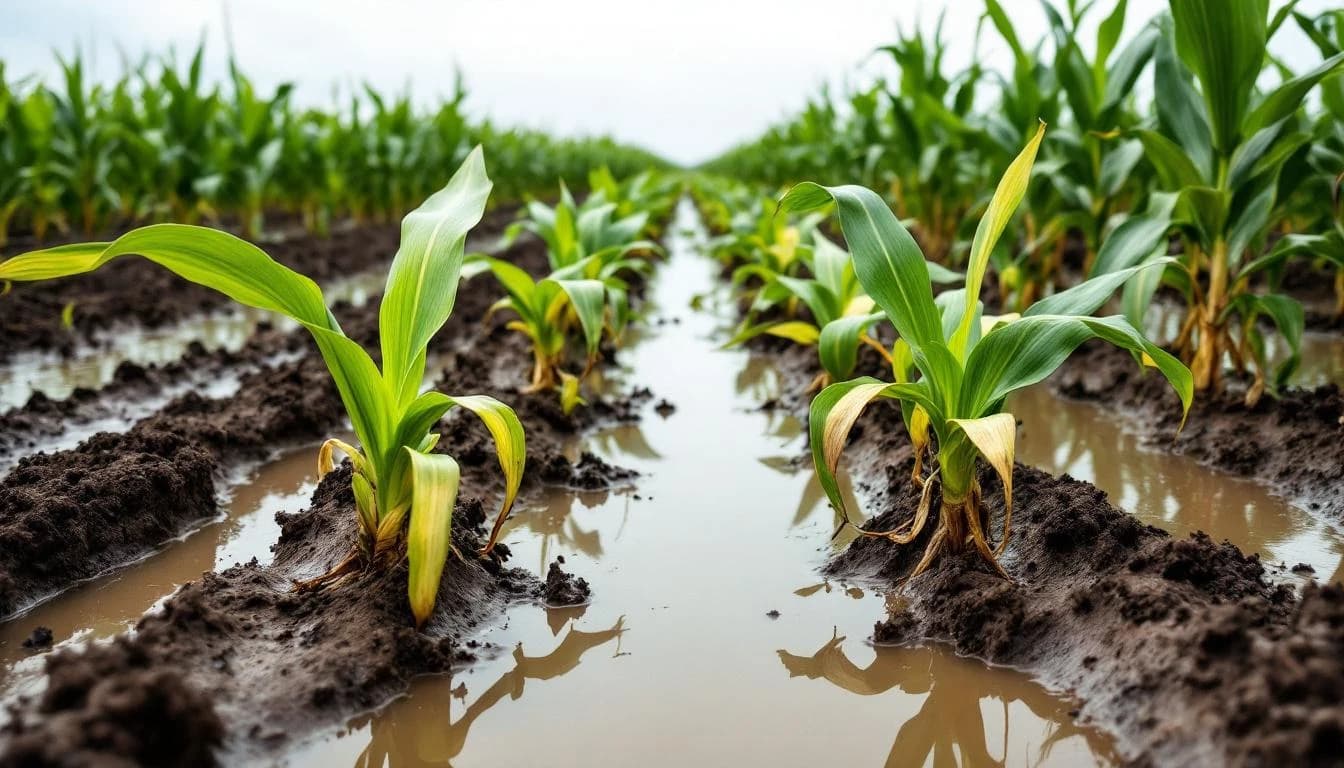
That trapped water saturates the root zone, displaces oxygen, and creates the conditions for crop loss that looks like a disease problem but is actually a drainage problem.
On the other side of that same field, a slight rise of 8 centimeters creates a convex surface that sheds water in every direction. Irrigation water rolls off before it can soak in. The crop stress you see there isn't from under-watering — it's from micro-topography directing water away faster than your irrigation system can compensate.
The Scale of the Problem
Research from agricultural extension programs consistently shows that undetected drainage issues reduce yields by 10 to 25 percent on affected portions of fields. When you consider that these problem areas often cover 15 to 30 percent of a field's total acreage, the aggregate production loss is significant.
Consider the math on a 200-acre grain operation: if 20 percent of the field (40 acres) produces 15 percent below potential due to waterlogging and another 10 percent (20 acres) underperforms due to excessive runoff, the compounded yield loss translates directly to revenue left in the field every single year.
The frustrating part is that these losses are preventable. The elevation data needed to identify and fix every one of these problem areas already exists — it just needs to be captured at the right resolution.
Why Traditional Methods Miss the Problem
Farmers and agronomists have traditionally relied on three methods to assess field drainage:
Visual observation works for obvious problems — standing water you can see, erosion gullies you can walk along. But the micro-depressions causing chronic waterlogging are below visual detection. By the time you see standing water, the damage to the root zone has already started.
Satellite imagery reveals crop stress patterns after the fact. NDVI maps show you where yields dropped, but they don't tell you why. More importantly, satellite-derived elevation data — such as NASA's Shuttle Radar Topography Mission (SRTM) at 30-meter resolution — is far too coarse to detect 10-centimeter depressions across a field.
Traditional survey is accurate but impractical at the density needed. A survey crew collecting elevation points every 10 meters across a 200-acre field would need thousands of individual measurements — days of fieldwork producing a dataset that still misses the fine-grained undulations between measurement points.
What Drone LiDAR Reveals
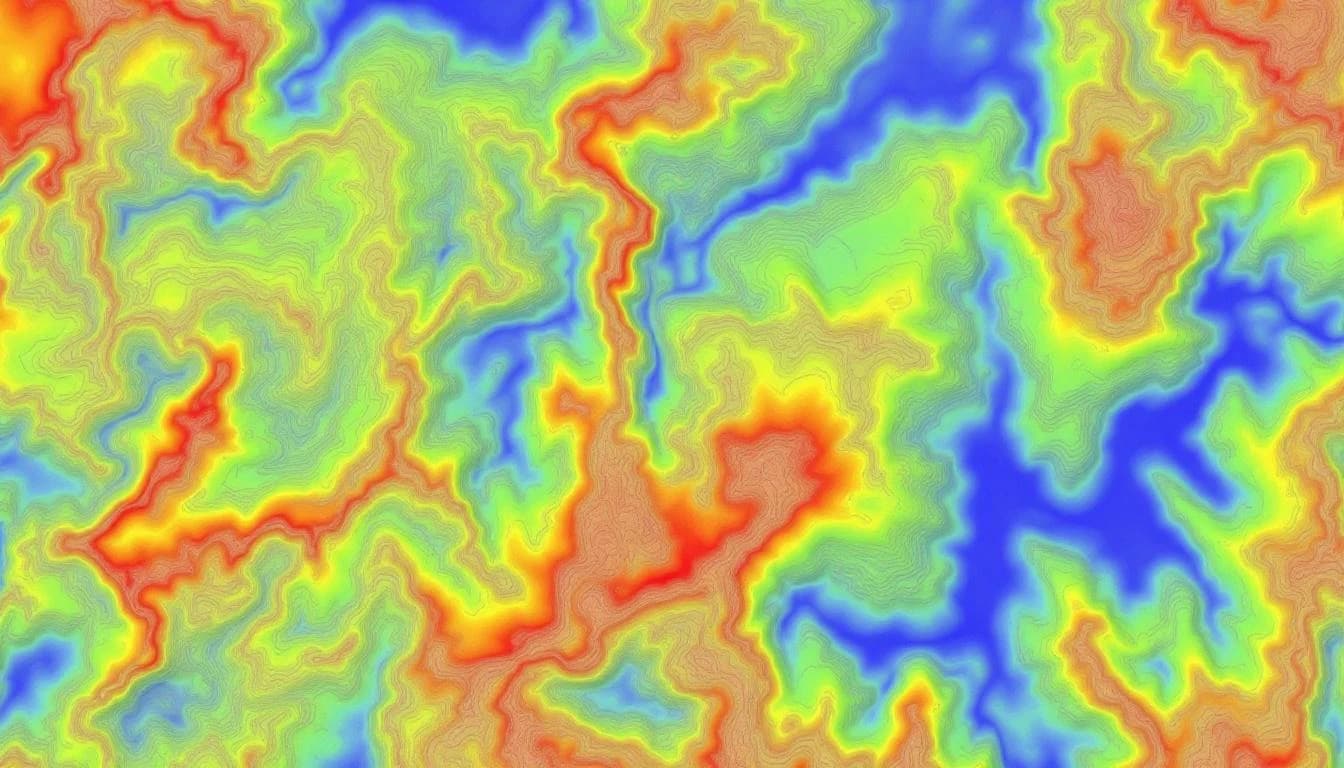
Drone-mounted LiDAR sensors change the equation entirely. A single flight over a 200-acre field captures millions of elevation measurements at sub-5-centimeter vertical accuracy. The resulting digital elevation model shows every micro-depression, every ridge, every subtle slope change across the entire property.
When you look at a LiDAR-derived elevation map of a field for the first time, the reaction is almost always the same: "I had no idea." Fields that appear perfectly flat reveal complex surface patterns — shallow channels that concentrate flow, depressions that trap water, ridges that divert irrigation, and slope breaks that accelerate erosion.
From this elevation data, hydrological analysis software can model exactly where water flows during a storm event, where it accumulates, and how long it takes to drain. The output is not an approximation or a prediction — it is a physics-based simulation of water behavior on the actual surface of your land.
From Data to Solutions
Once the invisible topography is mapped, the solutions become specific and actionable:
Targeted drainage installation. Instead of installing tile drainage on a grid pattern (the traditional approach), LiDAR data identifies the exact locations where drainage is needed. This typically reduces the total footage of tile required by 30 to 40 percent while solving more of the actual problem areas.
Precision land leveling. With a centimeter-resolution elevation model, laser-guided land leveling can be specified to create controlled drainage slopes rather than a flat surface. The goal isn't a perfectly level field — it's a field where water moves predictably toward planned outlets.
Optimized irrigation design. Knowing the true surface topography allows irrigation systems to be designed around the land's actual shape rather than the assumed shape. Variable-rate irrigation zones can be set based on real drainage characteristics rather than soil maps alone.
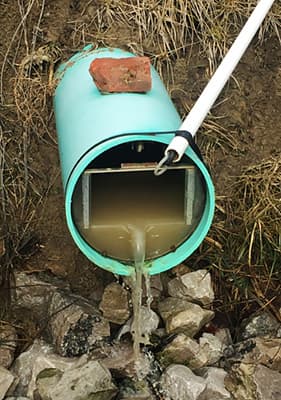
Strategic water harvesting. LiDAR analysis identifies natural low points and convergence zones where water can be captured efficiently. Farm ponds, contour bunds, and recharge structures placed using this data consistently outperform those placed by visual assessment or low-resolution mapping.
The Return on Investment
A drone LiDAR scan of a 200-acre farm typically costs between $3,000 and $6,000 depending on terrain complexity and deliverable requirements. The data remains useful for years — terrain changes slowly under normal agricultural use.
Compare that to the annual yield loss from undiagnosed drainage problems. If micro-topography issues reduce production by even 10 percent on 30 acres of a 200-acre field, the lost revenue in a single growing season almost certainly exceeds the cost of the scan.
More importantly, the drainage improvements, leveling specifications, and infrastructure placements derived from LiDAR data continue producing returns for decades. The scan is a one-time investment that informs permanent solutions.
What to Expect from a Terrain Scan
The process is straightforward and minimally disruptive. A drone technician visits the property to fly a pre-programmed autonomous mission. The flight typically takes 30 to 90 minutes depending on acreage. No ground preparation is needed, though the field should ideally be scanned when crop canopy is minimal — post-harvest or pre-planting is optimal for bare-earth accuracy.
Within 48 to 72 hours, the data is processed into a suite of deliverables: a digital elevation model, contour maps, slope analysis, flow direction mapping, and a drainage assessment report that identifies specific problem areas with specific recommendations.
The report isn't a data dump that requires a GIS specialist to interpret. It's a plain-language diagnostic of your field's water behavior with annotated maps showing exactly where the problems are and what to do about them.
Stop Guessing, Start Seeing
The invisible topography problem is not new — it has existed as long as farming has. What's new is the ability to see it affordably and act on it precisely. Drone LiDAR makes the invisible visible, and the data it produces transforms water management from guesswork into engineering.
If you've been watching the same wet spots appear year after year, wondering why certain rows always underperform, or suspecting that your drainage investment isn't working as well as it should, the answer is almost certainly in the micro-topography of your field. You just can't see it yet.