Grading progress · Flight simulation
What a drone LiDAR survey of a grading job looks like
A simulated flight over Newhall Ranch mass grading in Valencia, California. The terrain around it is real, and the points that fill in are the 2023 USGS lidar of the site.
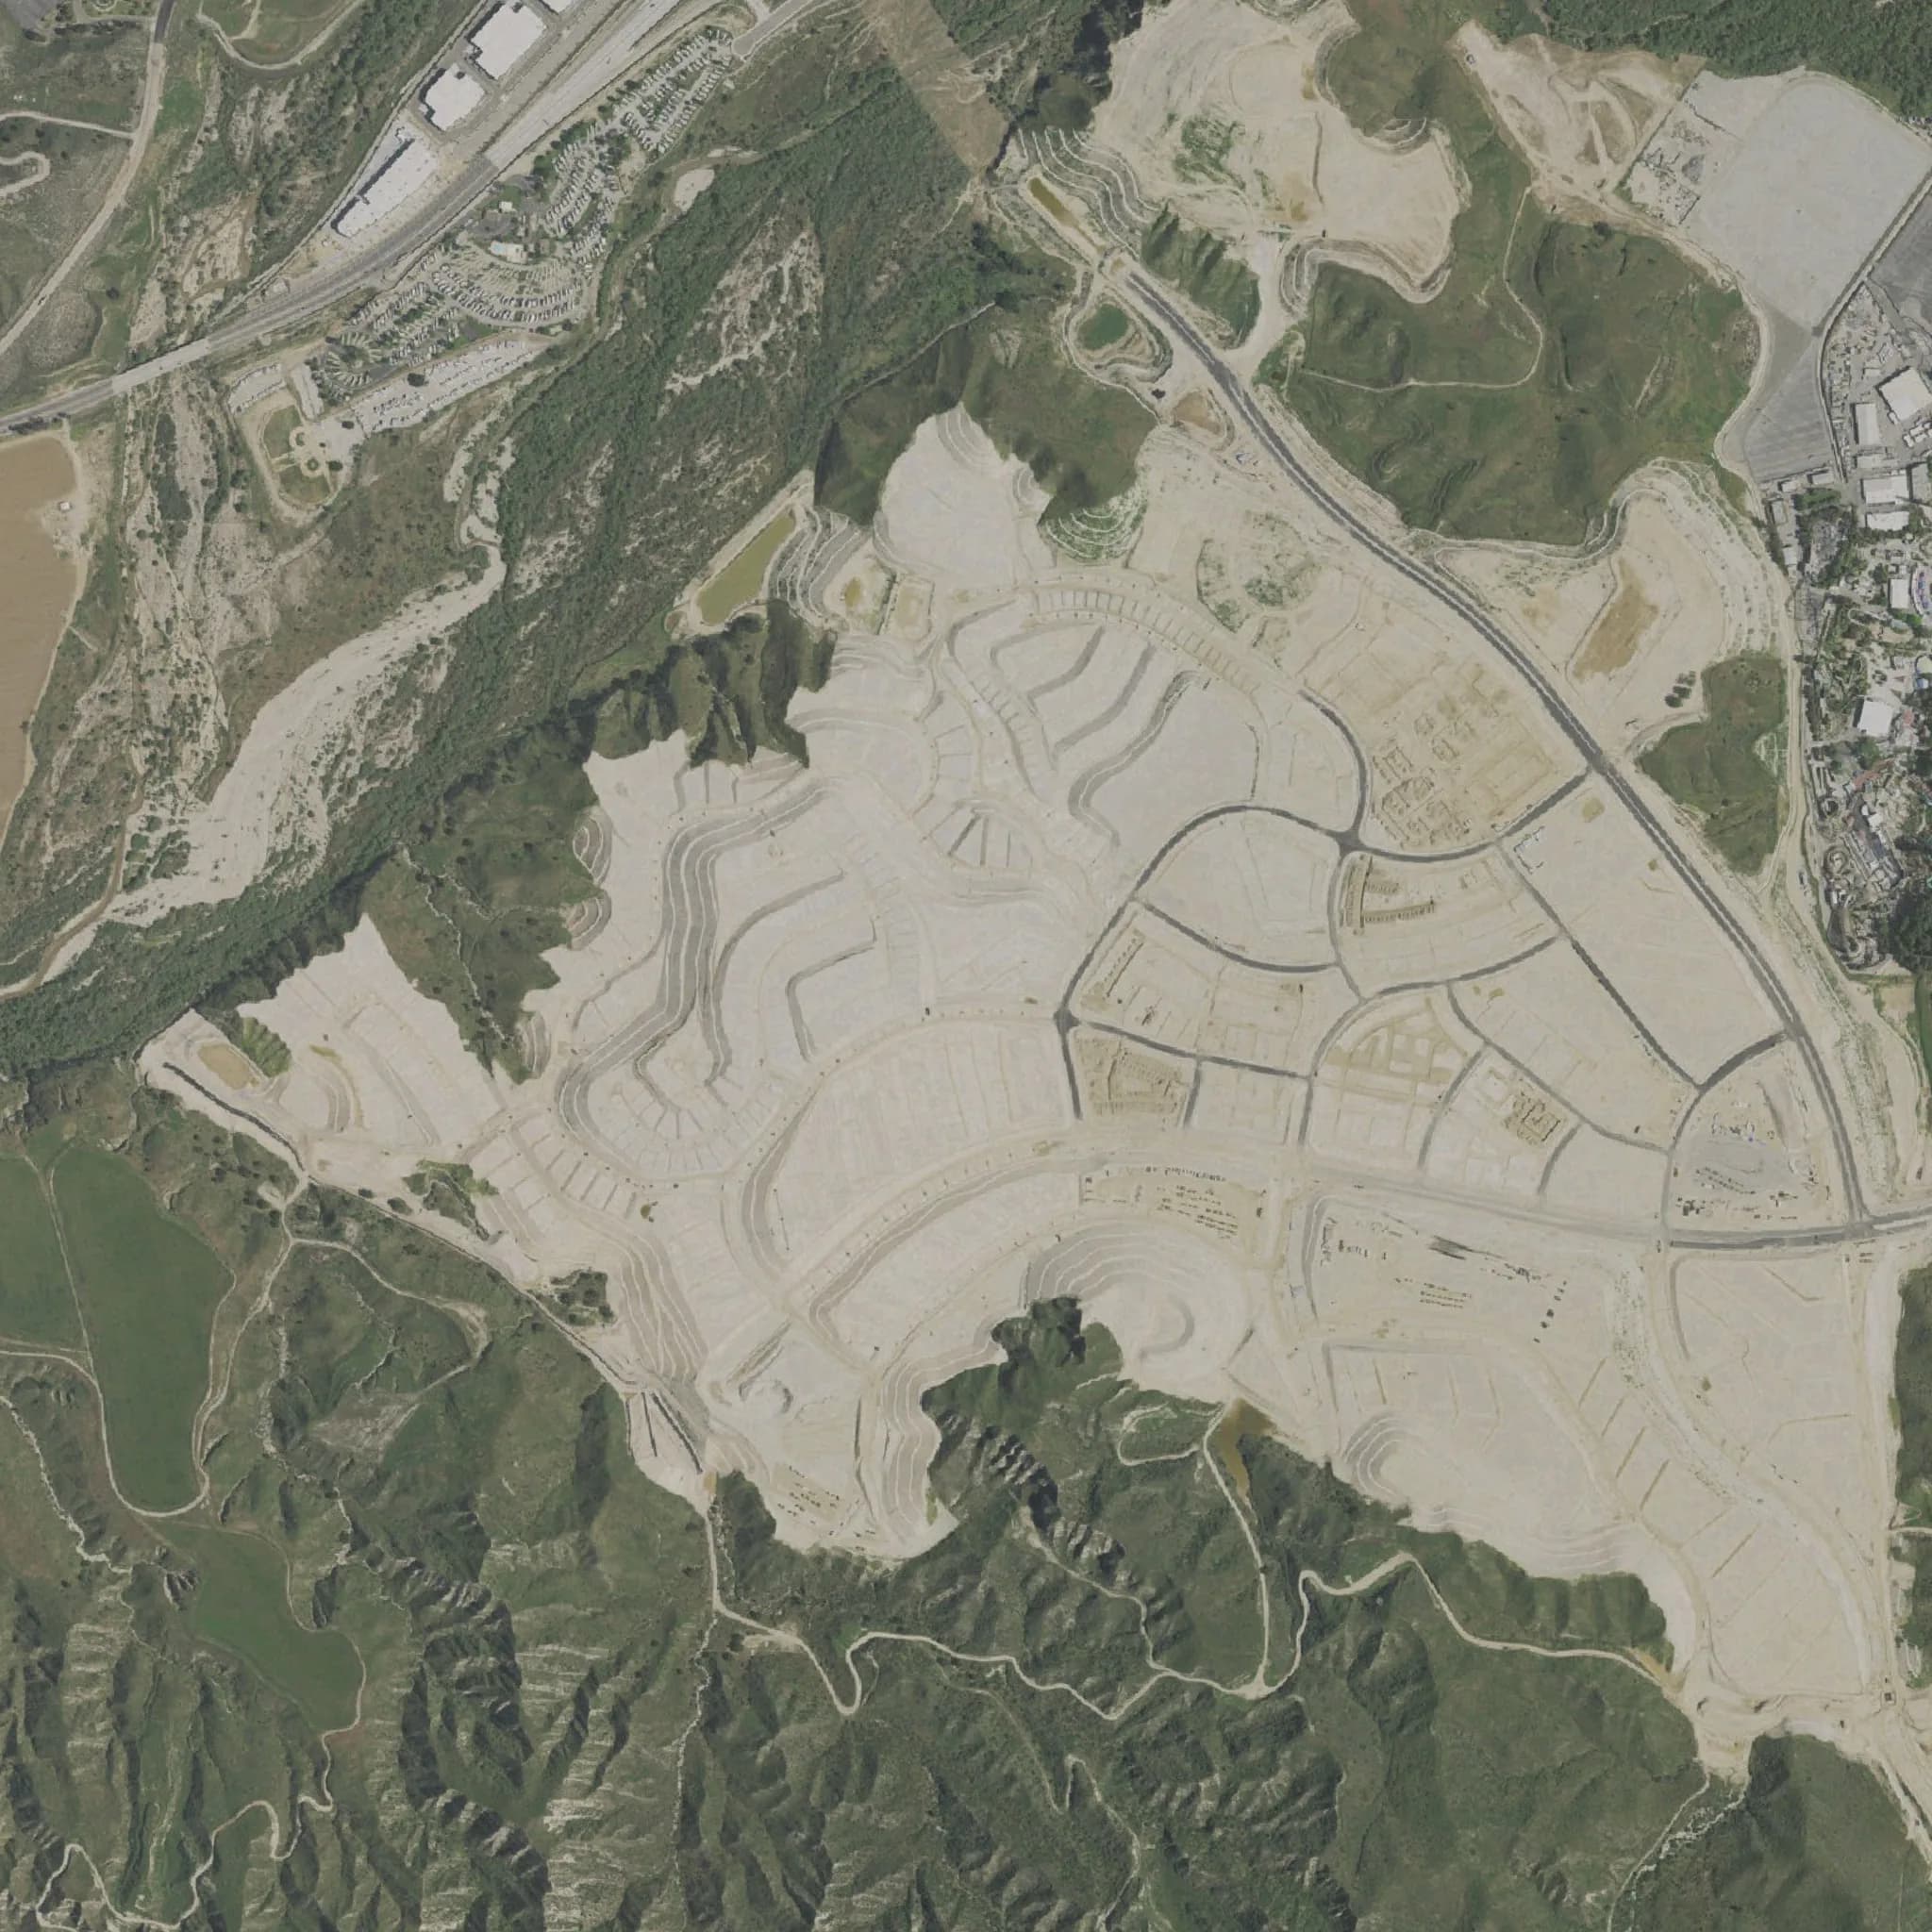
Interactive 3D · about 9 MB download
Simulation. The flight path is generated for this page and the drone is a generic model shown larger than life. The points are a published airborne lidar survey by the U.S. Geological Survey, replayed along the simulated path; they are not Twinn Digital project data. Sources
What you're watching
How a drone LiDAR survey is flown
The point cloud becomes this month's ground surface. Compared with the design grades and last month's survey, it gives cut and fill to date, what's left to move and where pads are high or low.
The flight is planned by software
Our AI agents lay the flight lines over a terrain model of the site, set the height above ground and the spacing between lines, and check the airspace. A licensed Part 107 remote pilot reviews the plan and is in command for the whole flight.
The drone follows the terrain
The aircraft holds a set height above the ground, climbing over ridges and dropping into low ground, so the laser footprint and point density stay even across the site.
Lines overlap side to side
Each pass sweeps a swath of ground with the laser. The next line overlaps it, so slopes facing away from one pass are seen from the other and gaps fill in.
The point cloud builds as it flies
Hundreds of thousands of laser pulses per second each return a 3D point. Back at the office the passes are aligned, checked against ground control and turned into the surfaces and numbers you file.
Then put the same data to work: grading vs design in 3d.
Want this flight over your site?
We rent the aircraft and sensor each job calls for, plan the flight with our AI agents, and fly it with a Part 107 pilot in command. Fast turnaround on the deliverables.
Credit
Sources
Point cloud: U.S. Geological Survey, 3D Elevation Program. USGS 3DEP lidar, Los Angeles County 2023 (CA_LosAngeles_1_B23). https://www.usgs.gov/3d-elevation-program · License: Public domain
Imagery: USGS The National Map (public domain).
Terrain: AWS Terrain Tiles (Mapzen), from USGS 3DEP, SRTM and other open sources.
The point cloud is a random sample of 1million points from the published survey. The terrain around it is a lower-resolution elevation model shifted to match the survey's elevations; inside the survey area it sits just under the points. The points are colored from aerial imagery: USDA NAIP imagery (public domain), via Microsoft Planetary Computer. Twinn Digital is not affiliated with the data publishers.