Before and after a qualifying precipitation event: re-surveying sediment basins and erosion controls under California's Construction General Permit
October 26, 2026
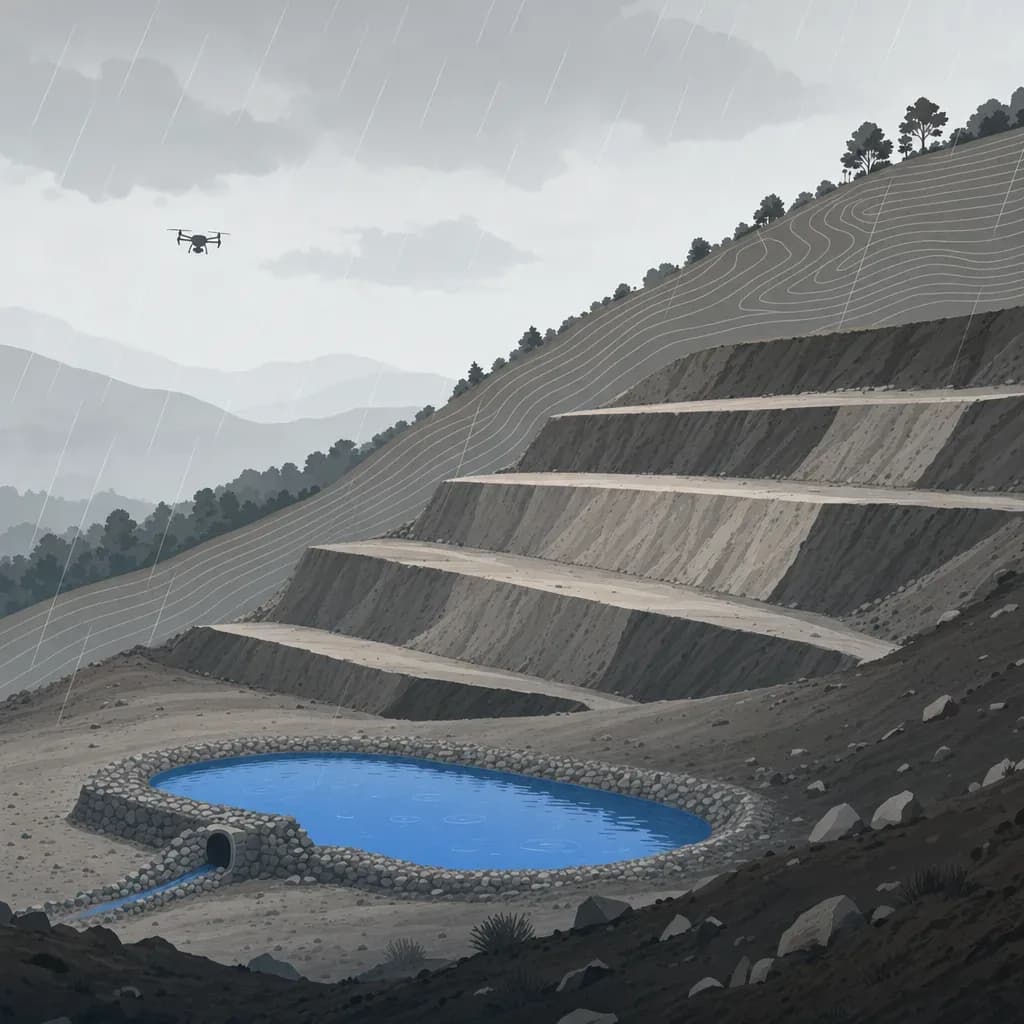
The water year started on October 1. If you run grading in Southern California, the first storm that matters is probably still weeks away, and that is the best time to decide how you will document what it does to your slopes and basins.
The Construction General Permit tells you when to inspect. It does not tell you how much dirt moved. This post covers what the permit asks around a qualifying precipitation event, what a pair of surveys flown before and after can add to that record, and where the method runs out of precision. It uses one worked basin example with made-up numbers, labeled as such.
What the 2022 CGP asks for around a storm
The current permit is Order WQ 2022-0057-DWQ, effective September 1, 2023. It is built around the qualifying precipitation event, or QPE. The permit's definition in Attachment B is a forecast, not a measurement: a weather pattern with a 50 percent or greater probability of precipitation and a forecast of 0.5 inches or more in 24 hours. It continues through each following 24-hour period forecast to have 0.25 inches or more.
The inspection duties in Attachment D, section III.C hang off that definition.
| When | What the permit says |
|---|---|
| Before | A QSP inspects within 72 hours before the forecast QPE, or up to 120 hours ahead if the National Weather Service has an extended forecast. It covers drainage areas, all BMPs, and "available capacity" in stormwater storage and containment areas. |
| During | Visual inspection at least once every 24-hour period of the QPE. |
| After | Within 96 hours after the QPE, if the on-site rain gauge measured 0.5 inches or more. It asks whether BMPs were adequately designed, implemented and effective, which need repair, and which additional ones are needed. |
| Repairs (section II.J.1) | Begin maintenance, repair or design changes within 72 hours of "identification of failures or other shortcomings," and finish as soon as possible, before the next forecasted precipitation event. |
The State Water Board's QPE guidance walks through the forecast arithmetic using the NWS weather table. It also covers what to do when the forecast shifts a day. Read it before the first storm, not during it.
Two more items matter for erosion and sediment work. Sediment basins must be designed to the CASQA Construction BMP Handbook method, with outlets that withdraw water from the surface, and installed before other land disturbance. And the stakes are real: the Water Code lets a regional board impose administrative civil liability of up to $10,000 for each day a violation occurs, plus other amounts for discharged volume. This post does not say how much any given exceedance would cost. That depends on the facts.
What the permit does not do is require a survey. The compliance record is the inspection checklist: photos, a description of deficiencies, the weather, and the approximate area exposed. A repeat survey is an addition to that record, not a replacement.
Why a storm needs numbers
An inspection answers "is the BMP working?" It answers it with a person's eyes and a camera. That is the permit's method, and it is adequate for most findings.
It is thin on a few questions that come up after a storm, and contractors say as much about surveying in general. A contractor in a vendor-produced testimonial video said that before drones the crew would "only do a beginning survey and then a survey at the end and that's it and no real production tracking in between" (credited to Ironclad Excavating in a Firmatek video). A Kokosing Heavy Contracting representative in a vendor-produced Identified Technologies video said past LiDAR surveys "may take up to a month to get the data results" and that they wanted "something more real-time."
On the weather side, a voice on the On Grade podcast put the contractor's position plainly: somebody will not show up, trucks will be short, and "God's going to make it rain that day". The storm happens when it happens. The survey has to be ready before it.
Three questions are hard to answer from photos.
- How full is the sediment basin, in cubic yards, and did that last storm move the number?
- Where did the cut slope lose material, and how deep are the rills?
- Did the corrective action work, or did the same line fail again?
A pair of surveys, one before the QPE and one after, gives an elevation difference for every cell on the site. Negative values are loss. Positive values are deposition. Summed over a polygon, they give a volume.
What the rain record says about timing
You cannot plan a flight around a storm you cannot predict. You can plan around the season.
Figure 1 uses daily gauge data from Los Angeles Downtown/USC and Riverside Municipal Airport for the 18 water years from 2009 through 2026. It counts calendar days with 0.5 inches or more.

The pattern is clear. At Los Angeles, about 96 percent of such days fell between October and April, and December through March averaged between 0.9 and 2.0 such days a month across the two stations. October and November together averaged under one such day at Los Angeles (0.9) and about 0.5 at Riverside. The first part of the season is quiet on average, and that is the window for a baseline flight.
A caution on what this chart is. A gauge day of 0.5 inches is a rough proxy. The CGP's QPE is a forecast, it spans 24-hour windows rather than calendar days, and a post-QPE inspection depends on the on-site gauge total for the whole event. Use the chart to understand the season, not to predict your inspection count. The counts come from your forecasts.
Figure 2 shows why you should not plan around the average.

In that record, Los Angeles had 2 such days in water year 2012-13 and 19 in 2022-23. Riverside ranged from 1 to 10. A budget built on a middle year will be wrong in both directions.
Baseline first
The comparison is only as good as the starting surface. Before the first forecast QPE, fly the site once the grading phase and BMPs you want to track are in place.
- Pick surfaces to track. Basins, cut and fill slopes, swales, and the stabilized entrance are the usual candidates. Draw polygons for each so every later flight is summarized the same way.
- Set control that survives the storm. Use the same fixed checkpoints at every flight. Put them on stable ground, not on a slope you expect to move. Mark them so the next crew can find them after the rain.
- State the vertical datum and grid. Use the same ones every time. A datum or geoid mismatch between epochs looks like erosion.
- Record the sensor and settings. Different sensors or flight altitudes change the noise. If the sensor changes mid-project, say so in the report.
- Check the surface against your checkpoints. ASPRS Positional Accuracy Standards, Edition 2 names vertical accuracy as RMSEv and sets a minimum of 30 checkpoints for a formal accuracy statement. On a small basin job you may not run 30, but you can still report the RMSEz of the checkpoints you did survey, for every epoch.
The timeline around a QPE
Here is a workable sequence. It is my suggestion built on the permit's windows, not a permit requirement.
- Forecast shows a QPE. The QSP schedules the pre-QPE inspection. The permit allows it up to 120 hours ahead when an extended forecast exists. If the baseline flight is stale, fly it now, in the same window and in dry weather.
- During the QPE. The 24-hour inspections continue. Nobody flies a LiDAR drone in the rain, and the survey is not what keeps you in compliance.
- First dry window after. Fly the same polygons with the same settings, and process against the same checkpoints.
- Inside the 96-hour post-QPE window. The QSP does the inspection and now has an erosion and deposition map to take on the walk. Ask the QSP where the map and the field view disagree.
- Repairs. Attachment D, section II.J.1, says repairs begin within 72 hours of "identification of failures or other shortcomings". The permit does not say whether a survey finding counts as an identification. A cautious reading is that a map showing a new rill on Tuesday may start that clock on Tuesday. Ask your QSD how they treat survey findings before the first flight.
The flight is the easy part. The decision at the end of it is the point: which BMP gets repaired, where, and before the next storm.
A worked example: one sediment basin (illustrative numbers)
The numbers below are made up for a hypothetical basin. They are not from a real site.
| Item | Illustrative value |
|---|---|
| Design storage | 700 cy |
| Surface area of the basin | 0.2 acre (about 809 m²) |
| Remaining storage from the post-storm survey | 428 cy |
| Sediment accumulated | 700 - 428 = 272 cy |
| Share of design storage still open | 428 / 700 = 61.1% |
The survey did not say "about 60 percent full." It gave a number. Now ask how much to trust it.
If every cell in the basin were off by the same amount, the volume error is the offset times the area. At the DJI L2's 4 cm vertical specification at 150 m, a lab figure, that is 0.04 m x 809 m² = 32 m³, or about 42 cy. Using that spec as a uniform offset is an assumption for illustration; DJI does not publish it as a bias or an RMSE. At the 7 cm RMSE an independent test found over open road, it is about 74 cy. Against a 700 cy basin, the answer could move by roughly 6 to 11 percent of design storage from a uniform bias alone.
Random error averages down across thousands of points. A shared offset does not. That is why the same checkpoints and the same processing matter more than any one accuracy number. If both flights carry the same offset, it cancels in the difference.
Two limits are specific to basins.
- Water. A basin built to the CASQA method has surface-withdrawal outlets, so it often holds water after a storm. Near-infrared LiDAR does not measure the bed under standing water as a rule. Plan the survey for when the pool is drawn down, or survey the exposed part and treat the submerged part separately. This is general physics, not a number from a source I opened.
- The cleanout trigger. Your SWPPP or basin design says when sediment gets removed. The survey gives you the volume. It does not set the threshold.
What a two-survey comparison can and cannot see
Every elevation difference carries the noise of both surveys. If the errors are independent and unbiased, the smallest change you can call real in one cell at 95 percent confidence is 1.96 times the square root of 2 times the RMSE. That is my calculation, not a published guarantee. Figure 3 shows it for three vertical error values. The first bar treats the DJI 4 cm lab specification as if it were an RMSE. That is an assumption: DJI publishes a system accuracy figure and does not state which statistic it is.

The Tamimi and Toth test measured about 7 cm over open road and 21 cm for forest checkpoints, which is the right warning for any slope with brush. Bare earth on a graded pad is closer to the first number than the second, but a recently stabilized slope with straw or tackifier on it may not be.
Here is what that means for the questions above.
- Rills and gullies with depths of several inches or more stand out. Cell-by-cell, a 15 cm rill clears the 4 cm case but not the 7 cm one. Averaging across the rill's length and width helps, and so does a bigger drop.
- Thin sheet loss of a centimeter or two is mostly below the noise in any single cell. Averaged over a large, clean polygon it can still show up, but a shared bias can mimic it. Do not report it as a measurement without testing against checkpoints on that slope.
- Basin volume change is large relative to the noise, because it sums over a big area. That is where the method is strongest.
To size a volume from a depth, the arithmetic is simple. One centimeter of uniform loss over one acre is 4,046.9 m² x 0.01 m = about 40.5 m³, or 53 cy. Ten centimeters is about 530 cy per acre. Small depths over big areas add up to real yardage, and they also sit in the noise. Treat any such number as a bounded estimate and say which bound you used.
Who signs what
Twinn captures and processes the data. Twinn does not stamp.
Whether a deliverable needs a licensee depends on what it is for. A monitoring volume that goes in a SWPPP file as a record is one thing. A basin redesign, a topographic map, or elevations used for design or a permit is another. In California, B&P Code section 8726 defines the practice of land surveying, and BPELSG Bulletin 50 addresses drones and land surveying. The licensee in responsible charge is a PLS or a civil engineer legally authorized to practice land surveying. If a geotechnical engineer wants to rerun a slope analysis on post-storm geometry, that engineer decides whether the survey meets their needs. Ask before the flight, not after.
If a project involves federal funds, check SAM.gov for the current status of any sensor before you specify it. Do not assume.
What to settle before the first storm
- Who decides what gets measured: the QSD, the QSP, the contractor, or the engineer.
- Which polygons are tracked, and what the stable checkpoints are.
- The weather rule for flying: dry, winds within the pilot's limits, and a human Part 107 pilot in command who can say no.
- Basin condition: drawn down or not, and what you will do about the pool.
- What the report must contain: surface differences, volumes by polygon, per-epoch checkpoint RMSE, and a plain note on detection limits.
- Who reads it and what decision it feeds, such as a repair, a cleanout, or a SWPPP amendment.
None of this is required by the permit. All of it makes the next inspection checklist easier to defend, because a number comes with a method.
Next step
If you are a surveyor or engineer scoping erosion and sediment monitoring for a grading project this season, start with the baseline and the checkpoint plan. Twinn Digital rents the sensor per job, plans flights with software agents, and flies them with a human Part 107 pilot and is $2M insured. See the surveyors and engineers page for how capture and processing fit around your licensed work.