Before the first storm: what a 1 m terrain model shows about landfill slopes and drainage
October 28, 2026
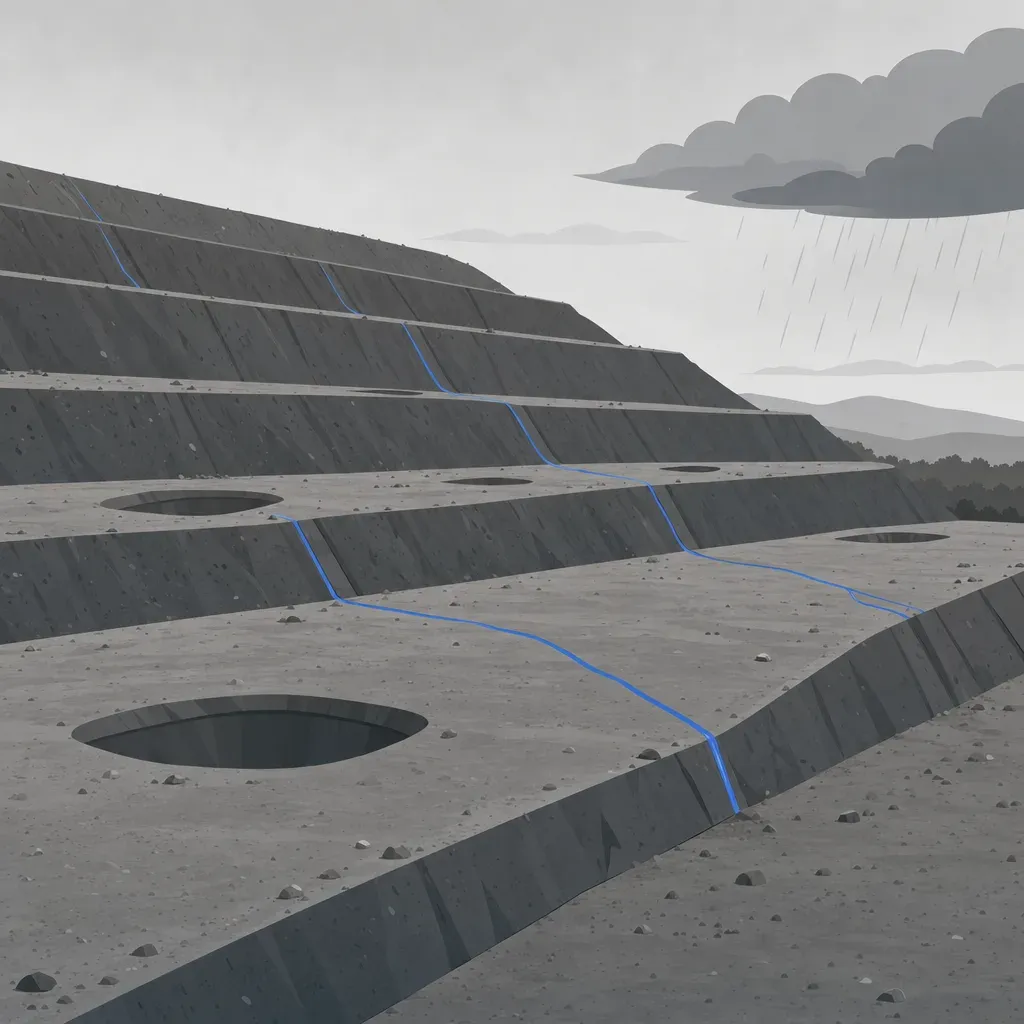
The manager of Butte County's Neal Road Recycling and Waste Facility described the wet season after the Camp Fire at a SWANA NorCal webinar on February 12, 2021. "We had over 37 inches of rain from late November to two weeks after the fire through the rest of that water year," he said. "We did not anticipate getting over three feet of rain in an area that normally receives 24 inches of rain annually" (SWANA NorCal webinar, 51:15 and 51:23).
Nobody forecasts that. What you can do before the season is look at the ground. A terrain model shows which slopes are steep, where runoff will gather, and where water can sit. This post runs that check on one real site using free public lidar, then explains what it can and cannot tell you.
The site is Olinda Alpha in Brea. The method works for any landfill with a recent 1 m DEM. The result is a baseline: the pre-season surface that a post-storm re-flight gets compared against.
What the rules say about water and slope
Two sections of Title 27 frame the check. Both come from the California Code of Regulations.
27 CCR 20365 covers precipitation and drainage controls. It asks that drainage be designed and maintained to "effectively divert sheet flow runoff laterally, or via the shortest distance, into the drainage and collection facilities." It also asks for energy dissipators and slope protection to prevent surface erosion. For operating portions of a unit, it says to take into account "the Unit's drainage pattern at any given time." After storms, "collection and holding facilities" must be "emptied immediately following each storm or otherwise managed to maintain the design capacity of the system." And the discharger must "periodically remove accumulated sediment" from basins.
27 CCR 21090 covers final covers on closed landfills. It sets a minimum slope of three percent on all portions of the final cover, with exceptions the Regional Board can allow. Areas "with slopes greater than ten percent" must be protected from erosion or designed to prevent it. It also says the final grading design must be approved by "a registered civil engineer or certified engineering geologist."
Both numbers are final-cover standards for closed landfills. Olinda Alpha is an active landfill, so 21090 does not govern most of its surface today. The 3 and 10 percent breaks below are yardsticks borrowed from the final-cover rule. They are not compliance findings, and nothing here says any slope at Olinda is or is not compliant. Your own permit, closure plan and Regional Board orders set the real limits.
Step 1: slope classes
Slope is the first thing a 1 m DEM gives you. The data here is the USGS 3DEP one-meter tile x42y376 from the CA SoCal Wildfires B1 project. Its metadata says the lidar was collected from May 27 to October 12, 2018. It describes the surface as bare earth, in NAD83 UTM meters with NAVD88 elevations.
The outline used here is approximate: a rough polygon around the benched fill, drawn by hand on a hillshade. It is not the permit boundary or the waste limit. It covers about 212 acres, and every share below depends on where it was drawn. Figure 1 sorts that area by slope.

The numbers, computed from the tile:
| Slope class | Share of outline | Area |
|---|---|---|
| Under 3% | 10% | 20 acres |
| 3 to 10% | 20% | 43 acres |
| 10 to 25% | 26% | 55 acres |
| 25 to 33% (4:1 to 3:1) | 25% | 53 acres |
| 33 to 50% (3:1 to 2:1) | 15% | 32 acres |
| Over 50% | 4% | 9 acres |
Seventy percent of the outlined area is steeper than 10 percent. The median slope is 22.7 percent. That is what you expect from a benched fill: flat-ish decks between steep faces.
Three things to read from a table like this before the season:
- The steep classes are your erosion exposure. The 33 percent and steeper faces total about 41 acres here. Those are the faces where a bare or damaged cover loses soil fastest. A re-flight after a big storm should start with them.
- The flat class is where water can sit. About 20 acres sit under 3 percent. Some of that is deliberate, such as haul roads and the top deck. Some may be settlement. The map shows which is which.
- One-meter slope is noisy. A 1 m grid turns every rut and berm into a slope. Use the classes to find areas to inspect, not to certify a grade.
Step 2: where the water goes
A DEM also tells you where runoff will travel. The method fills the surface's depressions, routes flow to the steepest downhill neighbor (the D8 method), and counts how much area drains through each cell. Figure 2 draws every path that collects at least 2,000 square meters, about half an acre. It also marks the closed depressions that the fill step found.

Two patterns show up.
Runoff follows the benches, then drops. The blue lines run along each bench and then cross the face at a few points. Those crossing points are where your downdrains, rock-lined chutes or energy dissipators have to be. If the 2018 surface routes water across a face somewhere your drainage plan has no chute, that is the first place to walk.
The surface holds water in places. The fill step found 11 closed depressions at least 0.3 m deep and 200 square meters in this window. Five sit mostly inside the rough outline. The two largest are 5.6 m and 5.7 m deep. By volume below their spill level in the 2018 surface, they come to about 16 and 11 acre-feet. They are probably basins or borrow areas, but that is a reading of the hillshade, not a sourced fact. The smaller ones inside the outline, 0.8 to 2.0 m deep, are the ones to look at on the ground. A pit on a deck or apron is either a designed sump or a place where rain will pond.
Treat these as leads, not findings. A closed depression in a DEM can be a pond, a sump, a culvert inlet that the DEM cannot see through, or noise. A lidar surface does not see pipes. Water surfaces also return poorly. Your drainage plan says which is which.
There is a trade-off worth planning for. The Neal Road manager described a fix that moved a problem. He said a rock trench built to collect leachate seeps meant that "corrective action for one water issue created an air emissions issue," because methane could migrate from the seeps (SWANA NorCal webinar, 52:04). A drainage change on a landfill touches gas, leachate and cover. Check what a regrade or new ditch crosses before you cut it.
Step 3: put the season in context
The first storm is not on a calendar. NOAA NCEI daily data for the Anaheim station (USC00040192, about 7.7 km from Olinda Alpha, by the author's calculation from the station and SWIS coordinates) shows how much it varies. Figure 3 uses 31 water years from 1990 to 2026. Thirty have at least 360 days of data, and water year 2026 runs through August 31. It leaves out six water years with longer gaps: 2005 through 2009 and 2012.

From the station record:
- Rain in an included water year ranged from 3.8 inches (water year 2002) to 33.0 inches (water year 2011). The median was 10.6 inches.
- About 92 percent of the rain fell from October through April.
- The first day with at least a quarter inch came on a median of November 8. The earliest was October 4 (water year 2016). The latest was January 26 (water year 2025).
Two lessons follow. A dry year does not remove the need for a baseline, because one storm does the damage. And a late start is not a reason to wait. The earliest start in this record was the fourth day of the water year.
The gauge is not at the landfill, and rain on a ridge can differ. Use the station for the shape of the season and your own site gauge for numbers.
What a 2018 public tile cannot tell you
The tile is eight years old. A working landfill changes every month. The public surface does not show today's fill, the current benches, the active face, any liner or cover work since 2018, or the pipes and culverts the water travels through. It is a historical baseline, and it is only a map of where to look.
Newer public coverage may not help. The National Map product listing shows a newer 1 m tile for the same grid square under the CA_LosAngeles_B23 project. Read for the window around Olinda Alpha, that tile had no valid elevation values. Check the coverage for your own site before you assume public data is current.
What a fresh flight adds
A new survey replaces the 2018 surface with the one that exists now. It should be tied to the same horizontal and vertical datums as your permit surfaces. A datum mismatch looks like change.
Accuracy needs a plain statement before you rely on a number:
- A sensor such as the DJI Zenmuse L2 is specified at 4 cm vertical and 5 cm horizontal at 150 m, measured in a DJI laboratory environment.
- An independent test of the L2 (Tamimi and Toth, ISPRS Archives 2024) found about 0.07 m RMSE on open road and 0.21 m under dense canopy.
- The ASPRS Positional Accuracy Standards, Edition 2 call for at least 30 independent checkpoints and name the vertical figure RMSEv.
Bare landfill benches are closer to open ground than to canopy, but that is an inference, not a tested result. Grass on closed slopes, scrub at the margins and wet ground will all matter. Ask for the RMSEv from independent checkpoints, not the sensor spec.
Turning the baseline into a post-storm check
Here is the use that matters in a wet season. A basin that is full of sediment cannot do its job, and 27 CCR 20365 asks that basins be emptied or otherwise managed after each storm and that sediment be removed. A pre-season surface and a post-storm surface tell you how much came in.
The arithmetic is simple. The areas come from Figure 2. The sediment depth and the bias are made-up values for illustration, not results from any site.
| Item | Value |
|---|---|
| Area of the largest depression in Figure 2, assumed here to be a basin floor | 5,057 m² |
| A 10 cm layer of new sediment over that floor | 0.10 m x 5,057 m² = 506 m³ |
| A 5 cm vertical bias in one survey, same floor | 0.05 m x 5,057 m² = 253 m³ |
If your survey bias is half the size of the deposit you are trying to measure, you cannot say much about the deposit. That is why the control, the datum and the checkpoint report matter more than the point count.
A practical sequence:
- Before the first storm, fly or compile the baseline surface. Mark steep faces, flow paths, basins and flat spots.
- Walk the leads from Figure 2 and confirm what each pit or crossing point is.
- After a major storm, re-fly the same areas on the same control and compare the two surfaces.
- Start with the 33 percent and steeper faces, the bench crossing points and the basins.
Who has to sign
A topographic surface, contours or volumes delivered for a permit or design are land surveying under California law. Business and Professions Code 8726 includes anyone who determines the configuration or contour of the earth's surface using mathematics or photogrammetry. The Board's Bulletin 50 says planning flights, piloting and capturing photos are not themselves regulated, but making a topographic survey for a client or public agency is. That work needs a licensee in responsible charge: a PLS or, in California, a civil engineer legally authorized to practice land surveying.
Twinn Digital captures and processes data. Flights are planned with software agents and flown by a human FAA Part 107 remote pilot, on equipment rented for the job, and the operation is insured for $2 million. Twinn does not stamp. A licensed partner reviews and stamps what goes into a submittal.
If any part of the work is federally funded, check SAM.gov for the covered-equipment status of the specific sensor before you scope it.
One practical next step
Before the first storm, pull the newest 1 m DEM for your site and do the three checks in this post. Then write down four things for the re-flight:
- The datum and grid your permit surfaces use.
- The control monuments and who maintains them.
- The areas to re-fly first: steep faces, bench crossing points and basins.
- Who will report RMSEv from independent checkpoints.
To plan a capture and processing job with a licensed partner stamping the deliverable, see Twinn Digital for landfills.