Truck counts versus survey volumes: which cleanout quantity holds up?
November 20, 2026
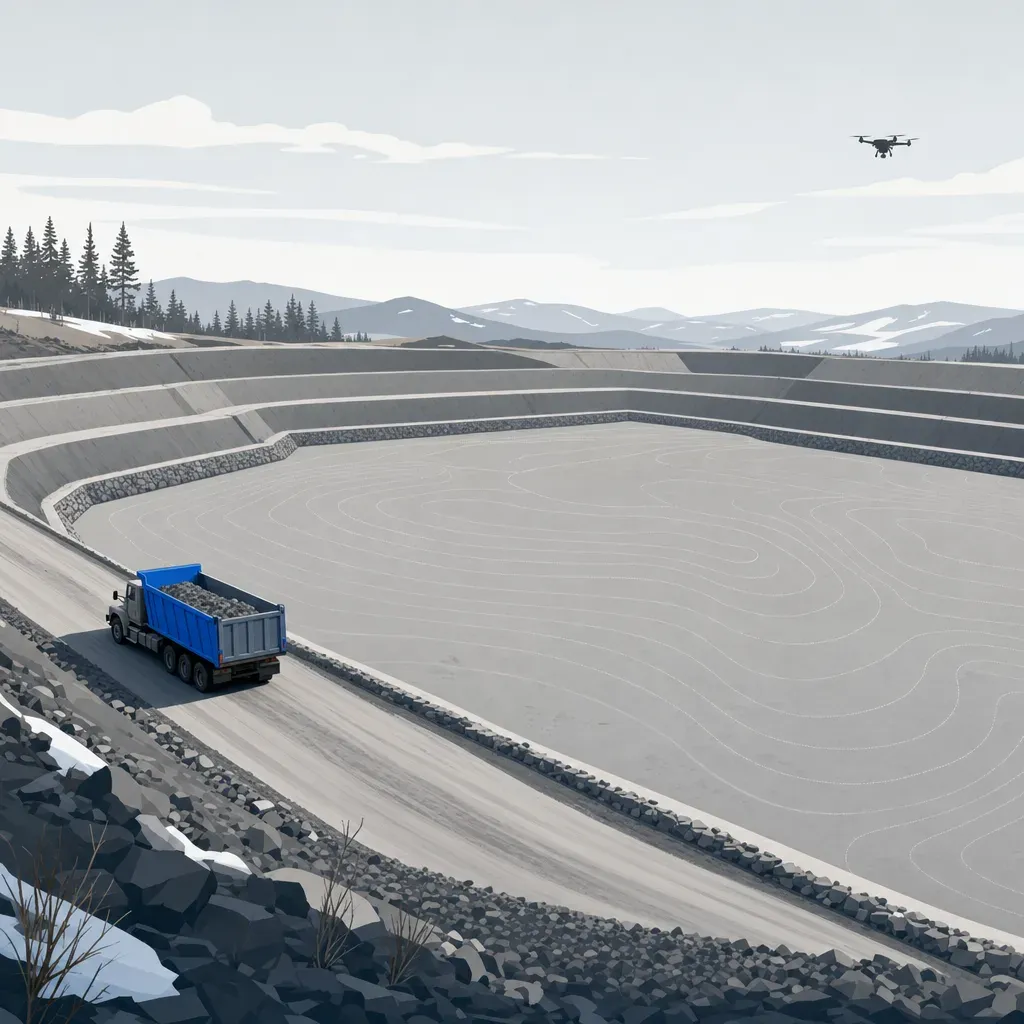
Santa Barbara County's environmental manager said the flood control program aims to finish routine maintenance "typically by December" (county video, 16:30). When the last truck leaves, someone writes down how many cubic yards came out.
That number goes into a pay estimate, a history table or a grant report. Often it comes from a count of truckloads. Sometimes it comes from subtracting one surveyed surface from another. The two do not always agree, and the public records are candid about it.
This post uses public records from Ventura and Los Angeles Counties to show where the two methods part ways, with a computed comparison for an 80,000 cubic yard (cy) cleanout and a list of what to settle first.
Two ways to say how much left the basin
A truck count is a tally of loads times an assumed volume per load. It is cheap, and crews already keep the pay sheets.
A survey volume is the difference between two surfaces: the basin before the cleanout and the basin after. Each surface is a DEM or TIN from aerial or drone data. The volume is the sum of elevation change times area, which is the same method used to measure landfill airspace.
Buyers in this field speak in loads. Santa Barbara County's Flood Control District described one basin as "approximately 1500 truckloads or 15 000 cubic yards of materials that got this Basin back to empty" (county video, 1:33). That is 10 cy per load.
Santa Barbara County Flood Control's engineering manager put a season's work in the Montecito area at "somewhere on the order of 75 000 cubic yards to 100 000 cubic yards that's equivalent to uh you know probably six or seven thousand dump truck loads" (county meeting, 15:29). Divide it out and the implied load is roughly 11 to 17 cy. That arithmetic is ours, and the speaker was rounding, but it shows how much room a "load" leaves.
What Ventura County's own records say
The Ventura County Watershed Protection District publishes a Debris and Detention Basin Manual (2019 draft). Each basin has a history table with the date, the action, the remaining capacity and the volume removed. Section 3.4 explains where those numbers come from.
It describes collecting "aerial survey data after the winter season to provide topography on pre-cleanout conditions," then running "another aerial or field survey" after the cleanout. Today the District converts the two topographic maps to TIN surfaces and subtracts them in AutoCAD.
It also says something about how much the surface math itself varies. A 2008 District study of Gabbert Debris Basin ran several volume methods on the same pre- and post-cleanout data. The results "differed by only 1%."
Then comes the passage that matters here:
> In 2005 O&M started reporting the excavation volumes for smaller basins using the truck counts contained on the contractor pay sheets. A volume generated in this way is marked as a "Truck Count" in the history table. A 2015 study by the District showed that the truck count volumes could differ from the topographical evaluation results.
The manual does not say by how much, and the 2015 study could not be found as a standalone document. The District's own history tables are the best public evidence of what "could differ" looks like.
Truck counts are not only for small basins
The manual says truck counts are used for "smaller basins." We parsed every history-table row marked "Truck Count" or "Truck count" (26 rows across nine basins, 2005 to 2017). Figure 1 plots them.

Five of the 26 entries are over 10,000 cy: Arundell Barranca at 19,667 cy, Real Wash at 14,365 cy, Gabbert Canyon at 29,680 cy, and Coyote Canyon at 10,680 and 49,076 cy. The 49,076 cy Coyote Canyon row is labeled "Multiple Cleanouts," so it is a sum, not one event. Even so, these are volumes that matter on any pay estimate.
Two bracketed cases
A fair test needs a survey before the cleanout, a survey after, and no big storm in between. Most rows in the manual do not meet that test. The "before" survey is usually from the previous spring, so a winter of new sediment has arrived by the time the trucks roll.
Two cases do come close. In both, the District ran a TIN analysis in June 2012, a truck-count cleanout followed in summer, and another TIN analysis followed in October 2012. Remaining capacity is measured to a fixed elevation each time. The gain between the two surveys is the volume that left, minus anything that arrived.
| Basin | Remaining capacity, June 2012 | Truck count | Remaining capacity, Oct 2012 | Gain in surveyed capacity |
|---|---|---|---|---|
| Coyote Canyon (p. 177) | 18,017 cy | 8,712 cy (July 2012) | 24,412 cy | 6,395 cy |
| Edgemore (p. 195) | 1,535 cy | 514 cy (Aug 2012) | 1,742 cy | 207 cy |

In both cases the truck count is higher than the surveyed gain: by 36% at Coyote Canyon and 148% at Edgemore.
Two basins is a small sample, and the manual does not say which number is closer to the truth. The Edgemore gain is only 207 cy, small enough for survey error alone to matter; the manual itself notes that "small increases in remaining capacity where no cleanout occurred are due to errors of survey." What the cases do show is that one basin can carry two defensible-looking numbers for the same cleanout.
Why a truck count and a survey disagree
Some of these are general earthwork practice rather than anything the Ventura records state. Those are labeled as inferred.
- Loose versus in-place volume. Soil swells when it is dug. A truck carries loose material, while a surface difference measures in-place material. Unless the count is converted, the truck number runs high. (Inferred, general practice. Swell factors depend on the material, so no number is given here.)
- Nominal versus actual load. A "load" on a pay sheet is usually a truck's rated capacity, not a measured quantity. Partial loads, heaped loads and mixed fleets all move the total. (Inferred.)
- Excavation limits. The manual notes that "increases in remaining capacity from one aerial survey to the next are due to differences in the excavation limits." If the crew digs beyond or short of the surveyed limit, the two methods are measuring different volumes.
- Deposition between surveys. Any sediment that arrives after the first survey reduces the gain, and a long gap between surveys leaves more time for it. (Inferred.) The two cases above have a June-to-October gap, normally the dry season in Southern California (inferred), which limits this effect but does not remove it.
- Rehandling. Material stockpiled and moved twice can be tallied twice. (Inferred.)
- Survey error. Each TIN surface has its own vertical error, and the volume inherits it.
None of these means a truck count is useless. They mean it answers a different question: how much material was hauled, rather than how much space came back.
Truck loads inside "measured" numbers: the Eaton basins
Truck counts also show up inside volumes that are described as measured. Los Angeles County's 2020-2021 Hydrologic Report lists "Debris Deposited" for each debris basin. A footnote on those pages says it is "an estimated figure based on the number of truckloads of debris removed from the basin."
The Caltech study of the 2025 Eaton Fire basins, Chen, Geyman and Lamb (Landslides, 2026), combines the two methods. The authors used UAV lidar to difference a January 20 airborne baseline against February 23 surveys. They then added the volume the County reported removing, "based on truck loads," between the two surveys to get the total sediment yield.
Table 2 of that paper gives the pieces. The table below recomputes the truck-load share for the six basins that had any excavation.
| Basin | Lidar volume change (m³) | Excavated, from truck loads (m³) | Deposited total (m³) | Truck-load share |
|---|---|---|---|---|
| Auburn | 10,372 | 772 | 11,144 | 6.9% |
| Devonwood | 1,776 | 459 | 2,235 | 20.5% |
| Kinneloa East | 13,524 | 1,671 | 15,195 | 11.0% |
| Lannan | 11,674 | 1,743 | 13,417 | 13.0% |
| Rubio | 26,201 | 9,221 | 35,422 | 26.0% |
| Sierra Madre D | 56,253 | 2,699 | 58,952 | 4.6% |
Source: [Chen et al. 2026, Table 2](https://lamb.caltech.edu/documents/34170/Chen_etal_Landslides_2026.pdf). The truck-load share column is calculated from the table's columns. The other eight basins in the table had no excavation reported.
This is not a test of truck counts against lidar. The paper does not compare the two for the same material, so it says nothing about how accurate the truck numbers are. It does show that a published, lidar-based sediment yield can rest on truck loads for a quarter of its total at one basin. If those loads carry a 10% error, Rubio's total moves by about 2.6%. That is our arithmetic, assuming the error is independent of the lidar figure.
The paper makes a second point about timing. Right after the February 13 storm, basins held sediment and ponded water. Between February 14 and 19 the average measured volume fell by 13.8% as water drained, and the authors write that estimates made right after the storm "likely overestimated sediment deposition by approximately 15% because of ponded water." Any survey volume is only as good as the day it is flown.
For scale, the same paper reports vertical RMSE of 2 to 3 cm over bare ground for its UAV lidar. That is bare ground, not brush or canopy. DJI specifies its Zenmuse L2 system at 4 cm vertical at 150 m in a laboratory environment. An independent test by Tamimi and Toth (ISPRS Archives, 2024) found 0.07 m on an open road and 0.21 m under dense forest canopy.
What a survey error costs on an 80,000 cy job
Ventura County's Adams Barranca Debris Basin notice of exemption, received April 17, 2026, describes a cleanout of "80,000 cubic yards of accumulated sediment and debris in the 3.3-acre" basin. It says removal last occurred in 2017, much of the sediment arrived in the 2023 and 2024 seasons, and the work would take about 75 working days.
It serves as a sizing example only: the notice gives a planned volume, and no public record was found of the final measured quantity. Over 75 working days that is about 1,070 cy a day. At an assumed 10 to 15 cy a load, it is roughly 70 to 110 loads a day, every working day. That is a lot of tickets to keep honest.
Now compare error sizes. A survey volume has error because each surface has elevation error. Assume equal vertical RMSE on both surfaces, and that each surface's error is one bias across the whole basin, such as a control offset. If the two flights' biases are independent, the volume uncertainty is about 1.414 times the RMSE times the area. If they ran in opposite directions at full size, it could reach 2 times.

With 5 cm of vertical error per surface, the worst case is about 1,235 cy, or 1.5% of the job. At 10 cm it is about 2,470 cy, or 3.1%. A 5% error in the assumed load size gives 4,000 cy, and 10% gives 8,000 cy.
Two cautions. A survey would also cover side slopes and access, which adds area beyond the 3.3-acre footprint. And random error averages down while a shared bias does not, so these figures sit at the high end for a given RMSE.
A survey is not perfect, but its error can be stated, tested with independent checkpoints and bounded. A load-size assumption is much harder to test after the fact.
What to settle before the cleanout
These decisions are cheaper to make before the dig than after it.
- Name the quantity of record. Say in the contract or work order whether the pay quantity is a surveyed volume, a truck count, or a truck count checked against a survey. Say what happens when they disagree, and by how much before it triggers a review.
- Survey before and after, close in time. The Ventura manual's practice of surveying "after the winter season" and again after the cleanout is the right shape. Keep both flights close to the work so storms and slumping do not hide in the difference.
- Fix the surface definitions. Agree on the datum, the grid, the excavation limit polygon and the reference elevation for remaining capacity. The District's tables report capacity "to elev" a stated value for a reason.
- Fly after the water drains. Chen and colleagues saw about a 15% overestimate right after a storm.
- Ask for checkpoints. Under ASPRS Positional Accuracy Standards, Edition 2, vertical accuracy is reported as RMSEv from independent checkpoints, with a minimum of 30 checkpoints. Vegetated vertical accuracy is to be "evaluated and reported" rather than used as a pass or fail test. Ask what the checkpoint count was and where the points sat.
- Keep the truck count too. It is the only record of what was hauled and where it went, which matters for disposal permits. Use it to cross-check the survey, and investigate large gaps rather than averaging them.
Who signs and who pays
In California, the topographic surfaces behind a pay or permit volume generally fall under land surveying. Business and Professions Code 8726 covers anyone who "determines the configuration or contour of the earth's surface" using mathematics or photogrammetry. The Board's Bulletin 50 says that capturing images is not itself regulated, but producing a topographic survey for a client or public agency is. That work needs a licensee in responsible charge: a PLS or, in California, a civil engineer legally authorized to practice land surveying.
Twinn Digital does not stamp. It rents equipment per job and is sensor-agnostic. Flights are planned with software agents and flown by a human FAA Part 107 remote pilot, insured for $2M. A licensed partner reviews and signs what goes into a quantity or permit. See compliance for how that split works.
If any federal money touches the cleanout, for example reimbursement after a declared disaster, check SAM.gov for the status of the sensor manufacturer before you choose equipment. Do not assume either way.
One practical next step
Pick one basin from this year's work plan and pull its history table. For each cleanout, note whether the removed volume came from a survey or a truck count, and whether a survey sits on both sides of it. If you find a case where both exist and they disagree, you have your own Figure 2.
Then decide which number will be the quantity of record. To plan before-and-after capture and processing with a licensed partner signing the deliverable, see Twinn Digital for debris basins.