Back to empty before December: what drone LiDAR measured in the Eaton Fire debris basins
November 4, 2026
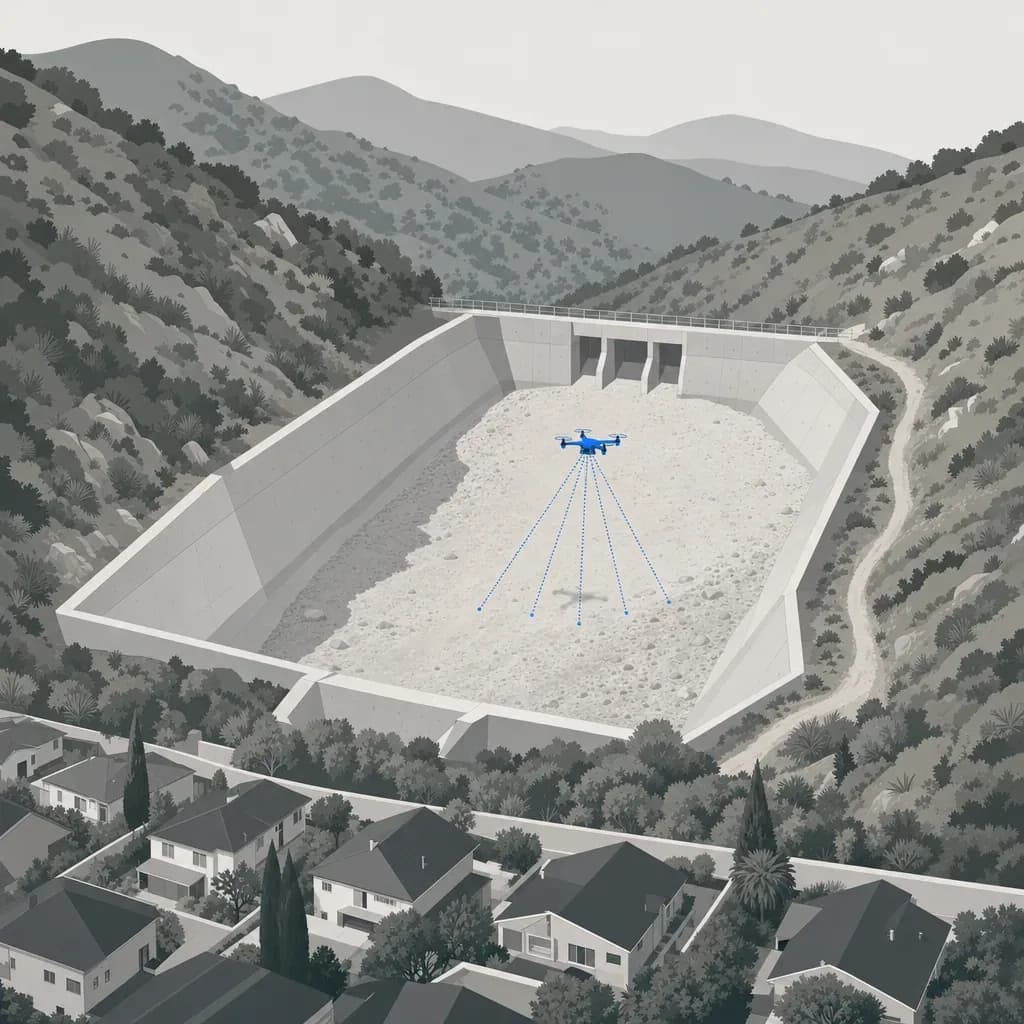
Santa Barbara County flood control staff describe the goal as getting a basin "back to empty". They say routine maintenance is typically finished by December, ahead of the rainy season. Proving a basin is empty takes a number in cubic yards, not a look from the access road.
On Sept. 23, 2026, LA County proclaimed a local emergency for the coming El Niño. Officials say they have emptied debris basins, cleared channels and readied the county's 14 dams. The top priority is land burned in the past five years, including the Eaton burn area.
That raises a practical question for anyone who owns or maintains a basin. How do you know, with a number, that it is back to empty before December? And how fast will you know how much room is gone after the next storm?
Caltech researchers measured this for 14 basins after the January 2025 Eaton Fire. They flew a drone LiDAR sensor before and after a major storm and published the volumes. This post walks through what they measured and how a county engineer, PLS or consultant can reuse the method.
How full the basins got: what Caltech measured
Chen, Geyman and Lamb flew a DJI Matrice 350 RTK carrying a DJI Zenmuse L2 over 14 Eaton-area basins. Their Landslides paper (2026) reports the storm of Feb. 13-14, 2025 delivered about 365,000 m³ of material to those basins. That is roughly 480,000 yd³, matching the figure on the public Zenodo record.
Chen reports the 14 sites ended up 12% to 59% full by design capacity. The 12% low end is Eaton Wash, whose capacity matches a dam reservoir, not a debris basin. The 13 debris basins ran 18% to 59% full. Figure 1 shows each one against LA County's cleanout triggers.

Reconciling two capacities
Chen's Table 2 and the county's Hydrologic Report agree on 11 of the 13 conventional basins within about 4%. They disagree on two:
| Basin | Chen Table 2 | County report | Plotted in Figure 1 |
|---|---|---|---|
| Carriage House | 10,168 m³ (about 13,300 yd³) | 6,100 yd³ | County: 34% full (Chen: 16%) |
| Sunnyside | 3,823 m³ (about 5,000 yd³) | 3,400 yd³ | County: 53% full (Chen: 36%) |
Chen cites the county report as the capacity source, so the paper does not explain the gap. The chart uses the county figure because the county's cleanout trigger is written against its own capacity. Ask the owner which capacity governs before you quote a percentage.
Two more cautions apply to the chart:
- Chen's 14th site, Eaton Wash, is left out of Figure 1. Its capacity of 1,179,209 m³ equals the Eaton Wash Dam's original 956 acre-feet in the county report (an inferred match), so it is a dam reservoir, not a debris basin. Chen puts it at 12% full. Against the 653 acre-feet from an August 2015 survey, it would be near 17%.
- Percent full is not percent safe. Chen notes the county's nominal capacities include upstream deposition cones that extend beyond the spillway. Field surveys found minor overspill at Sunnyside and Sierra Madre Dam, though no basin passed 60% of nominal capacity.
Where the volume went
Volume tells a different story from percent. The Eaton Wash reservoir caught the most material, about 182,500 yd³ (38% of the total). Sierra Madre Dam took about 77,100 yd³. Several small basins took under 5,000 yd³ but ran 18% to 53% full.

The cleanout triggers: when "empty" stops being empty
LA County cleans out debris basins at 5% full in burned watersheds and 25% full in unburned ones. A watershed counts as burned if more than 20% of its area burned in the previous five years. The same page says some basins in burned watersheds may need multiple cleanouts in a year.
Those triggers are small numbers in absolute terms. Using the county's capacities:
- Bailey (129,000 yd³): 5% is 6,450 yd³ and 25% is 32,250 yd³. Chen measured about 45,500 yd³ deposited.
- Carriage House (6,100 yd³): 5% is 305 yd³.
- Sunnyside (3,400 yd³): 5% is 170 yd³.
It matters for accuracy: 170 yd³ is about 130 m³, a 0.17 m layer over only about 760 m². At that size, a survey tells you to send a crew, not to write a pay quantity.
What the LiDAR looks like
Figure 3 shows Bailey Debris Basin in Altadena. The data are the public NCALM airborne point cloud on OpenTopography (CC BY 4.0, flown Feb. 20-21, 2025) and a pre-fire USGS 3DEP flight from 2023. Both are airborne, not drone, data. They show what a ground-classified surface and an elevation-change map look like for this basin.

The connected region that rose more than 0.3 m has an 8,700 m² footprint and holds about 34,400 m³ (45,000 yd³). Chen's Table 2 gives 34,815 m³ for Bailey. That is a 1% difference.
Do not read that as validation. The baselines differ (2023 versus Chen's Jan. 20, 2025 flight), no checkpoints were available, and a 2 cm vertical offset between the datasets was removed using stable ground. It shows only that the two measurements point the same way. The figure is the product itself: a clean surface and a change map you can compute a volume from.
Proving a basin is back to empty: the pre-season survey
A pre-season survey answers one question: where does each basin sit against its trigger today? The deliverables should include:
- A ground-classified point cloud (LAS 1.4) and a 1 m or finer DEM in the district's datum.
- A volume table per basin: current volume, design capacity, percent full, and the trigger value next to it.
- Cross-sections through the floor and outlet, so the engineer can see how deposits sit relative to the spillway.
- A checkpoint report. ASPRS Edition 2 asks for at least 30 checkpoints each for non-vegetated and vegetated accuracy. Fewer needs a special reporting statement. Accuracy is named as RMSE, and vegetated accuracy is reported as found, not pass or fail.
- The capacity basis written down: which report, which year, which datum, and whether upstream cones are counted.
Chen's team also showed why a repeat-survey habit pays. Each survey becomes the baseline for the next, so you can track cumulative fill through a storm season instead of guessing from the last cleanout. They also measured dry-ravel loading in channels before rain. About 23% of the dry-ravel material in the Bailey catchment had not been cleared out by the first storm. That residual can move into a basin with less room left.
After the storm: how much room is gone
A DEM of difference (DoD) subtracts the baseline surface from the post-storm surface. Positive cells are fill and negative cells are scour or excavation. Summing the cells gives volume.
Chen's team used the same pattern at storm scale. They flew ten survey dates between Jan. 25 and Mar. 24, 2025. The pre-storm baseline was airborne LiDAR from Jan. 20-21, and the storm-delivered volumes came from the Feb. 23 flights.
Their flight setup is a useful template:
- Platform and sensor: Matrice 350 RTK with a Zenmuse L2, plus an Emlid Reach RS3 base.
- Altitude: 100-120 m above ground, terrain-following.
- Overlap: 80% front, 20% lateral.
- Speed: 6 m/s average, 15 m/s maximum.
- Density: 500-700 points/m², with orthomosaics at 2-3.5 cm per pixel.
- Positioning: RTK for navigation, then two-stage post-processed kinematic (PPK) correction for the point cloud.
- Ground classification: a simple morphological filter in PDAL, then ICP alignment between epochs.
These are the researchers' settings, not a specification.
Separating water from sediment
Right after a storm, a basin floor can be underwater. The sensor measures the surface it sees, so ponded water reads as fill. Chen's team saw this directly. Repeat flights over basins in the Bailey catchments showed average basin volume falling 13.8% between Feb. 14 and Feb. 19, then another 2.3% by Feb. 23, as water drained. They concluded that an estimate made right after the storm overstated deposition by about 15%.
Practical rules that follow:
- Fly once soon after the storm to get a fast, conservative number, and label it "includes ponded water."
- Fly again after drain-down for the number that goes in a pay quantity or a trigger decision.
- Flag any pooled area in the DoD so reviewers know which cells are water surface.
For the Eaton basins, the airborne survey on Feb. 20 found basins mostly drained, with only 0-5% excess water.
Honest accuracy limits under brush
The 2-3 cm RMSE in the Caltech paper was measured over bare ground. A basin floor of fresh sediment is probably close to that case (an inference). The surrounding chaparral is not.
Three numbers frame what to expect:
- DJI specifies the L2 system at 4 cm vertical and 5 cm horizontal at 150 m.
- An independent test put the L2 on a Matrice 350 and measured about 7 cm RMSE in open terrain and about 21 cm under dense canopy. That is Tamimi and Toth, ISPRS 2024.
- For differencing, Chen's team set a minimum limit of detection (95% confidence). It is 0.17 m between two UAV surveys and 0.30 m between a UAV survey and the airborne baseline.
The limit of detection is the number that matters for volumes. A change smaller than that cannot be told apart from noise. If the whole 8,700 m² Bailey floor sat at the 0.17 m limit, that would be about 1,500 m³ (1,900 yd³). That is a ceiling from simple arithmetic, not an expected error. Random noise averages down over many cells, but a systematic offset between epochs does not. Good control and checkpoints are how you catch the offset.
Where to be careful:
- Small basins with low triggers sit near the limit of detection. Treat results as a prompt to inspect, not as pay quantities.
- Dense brush on side slopes and inlets has the weakest ground. Report vegetated areas separately and say so on the sheet.
- Compare surveys that use the same datum, control and processing, or the DoD picks up the difference between workflows.
Federal money changes the equipment
Most of this work is routine local maintenance. Some of it will be claimed for federal reimbursement, and that changes which aircraft can be used.
The American Security Drone Act (Pub. L. 118-31, secs. 1821-1833) bars a covered drone from federal money. Starting two years after enactment, no federal funds awarded through a contract, grant or cooperative agreement may be used to procure one or "in connection with the operation of such a drone". That date was Dec. 22, 2025. The restriction sunsets five years after enactment, on Dec. 22, 2028. Whether a maker is a covered foreign entity depends on the current federal designation. Check SAM.gov for DJI's status, and that of any other manufacturer, before kickoff.
FEMA public assistance is a federal grant, so a cleanout an agency claims from FEMA would be federally funded work. That is this post's reading of the statute text, not legal advice. Confirm with the agency's grant manager.
The practical consequence: if DJI is listed as covered, DJI hardware, including the L2, cannot be used on federally funded survey work. Ask one question at kickoff: "Will any of this be claimed under FEMA or another federal grant?" If yes, NDAA-compliant sensors are available on request.
The FCC's Dec. 22, 2025 Covered List action is a different mechanism. It blocks new equipment authorizations for foreign-made drones and does not ban flying drones already owned.
Who signs the numbers
A volume table or DEM delivered to an agency for a pay quantity or design is surveying work. California's licensing board speaks to this directly. When an operator creates a topographical survey and provides the finished product to a private client or public agency, the operator must be authorized by law to perform land surveying. That is Bulletin 50, citing Business and Professions Code sec. 8726. In California that means a licensed land surveyor (PLS), or a civil engineer legally authorized to practice land surveying, in responsible charge.
Flying and capturing the data is a separate activity. Twinn Digital captures and processes the data and does not stamp. Flights are planned with software agents and flown by a human FAA Part 107 remote pilot. A licensed partner reviews, signs and stamps. Georgia has its own rule, Ga. Comp. R. & Regs. 180-7-.04, and the licensed route applies there too.
Plan three things before any flight. Burn areas can sit under airspace restrictions, and Chen's team coordinated with the FAA, the U.S. Forest Service and LA County to get clearance and permission to fly. Basins also need access permission. Cleanout work may carry nesting-season limits.
Back to empty, and staying there, this El Niño
The county says it has emptied its basins. The question is what is left after the next storm. In February 2025, a single storm took every one of the 13 Eaton-area debris basins past the 5% trigger.
A reasonable monitoring plan has three parts:
- A pre-season survey of every basin in a burned watershed, with percent full against the trigger.
- A post-storm flight after each significant storm, then a second flight after drain-down.
- A post-cleanout survey, so the excavated volume is measured and not only counted by truck. In Chen's data, the county's excavation figures were reported from truck loads, and six basins had material removed between the January baseline and the Feb. 23 survey.
One practical next step
Pick one basin in a burned watershed and get a single capacity survey against its trigger before December and the next forecast storm. Ask for the LAS, the DEM, the volume table, the checkpoint report and a written capacity basis. Ask whether any of it is federally claimed.
Twinn Digital handles capture and processing for debris basin work and brings in a licensed partner for the stamp. See the debris basin page for scope and deliverables.