Is your slope moving faster than your survey error?
November 9, 2026
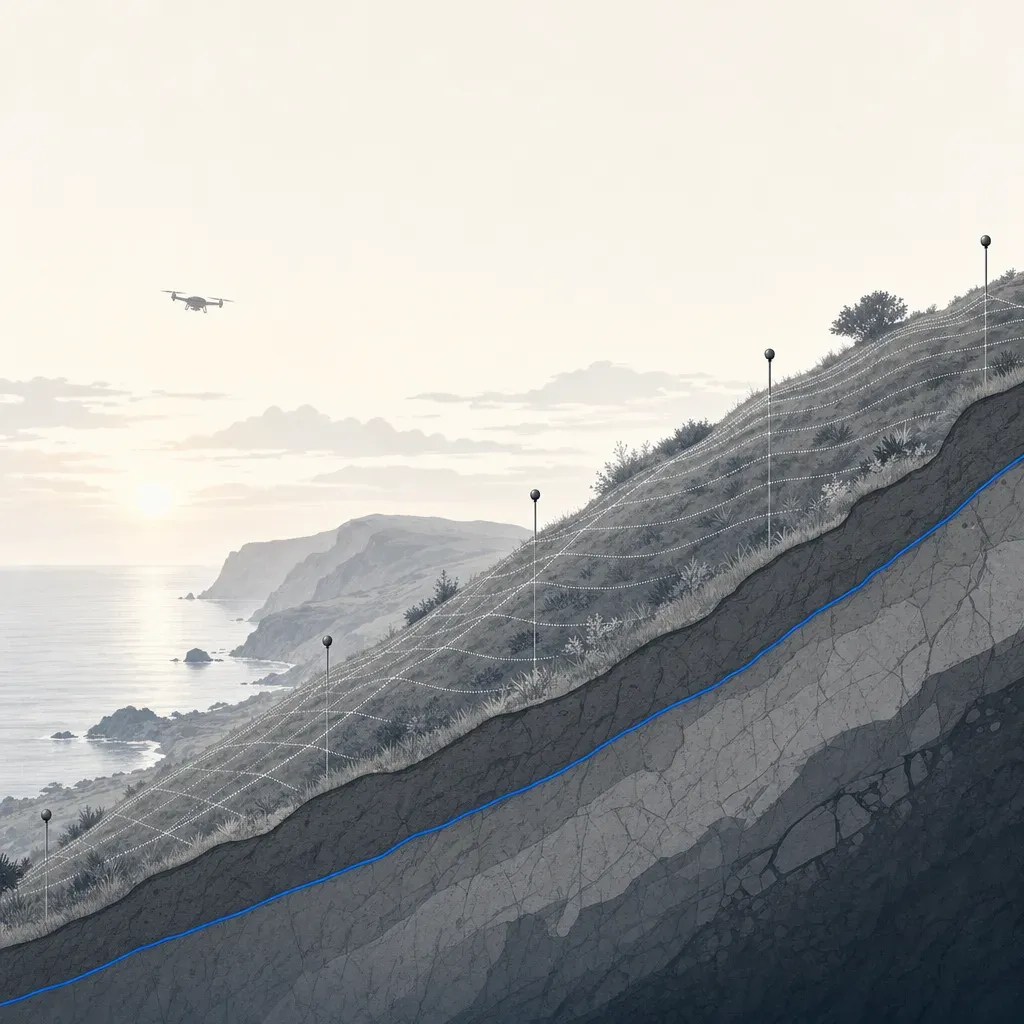
On September 9, 2026, Rancho Palos Verdes reported that the average movement rate across its active landslide had fallen to 0.99 inches per week. It was the first time below 1 inch per week since October 2023. The Portuguese Bend slide was at 0.81 inches per week, and Abalone Cove at 1.29.
That is good news. It also changes the measurement problem. When a slope moves a foot a week, almost any survey sees it. When it moves an inch a week, the question becomes whether your survey can tell movement from error, and how long you have to wait before it can.
This post uses the City's published survey reports to show how to answer that. The math is simple enough to rerun with your own numbers.
Where the rate stands
The City's monthly updates give three rates, in inches per week, for the surveys it has reported this year.
| Survey | Average, areas still moving | Portuguese Bend | Abalone Cove |
|---|---|---|---|
| Early January 2026 | 1.66 | 1.38 | 2.15 |
| Early February | 1.74 | 1.50 | 2.24 |
| Early March | 1.63 | 1.37 | 2.14 |
| Early April | 1.42 | 1.21 | 1.87 |
| Early May | 1.30 | 1.04 | 1.61 |
| Early July | 1.10 | 0.94 | 1.40 |
| Early August | 0.99 | 0.81 | 1.29 |
Source: the City's 2026 Community Updates archive, which lists no June value.
For scale, the same archive says movement "peaked at nearly 1 foot per week" in the summer of 2024. Southern California Edison has said it would need sustained movement under 1 inch per week near its infrastructure before considering re-energizing the Portuguese Bend area. Whether a rate is truly sustained under that line is a measurement question, and error is part of the answer.
What the City's surveyor says its error is
The movement numbers come from GPS monuments, surveyed by the City's surveying consultant, McGee Surveying Consulting. Its monitoring survey report says a full survey of about 100 points is run at the start of each month. A partial survey of about 20 points follows mid-month. The crew uses RTK GNSS receivers, and five reference points sit off the slide to check the frame on every visit.
The report states its error plainly. It says the uncertainty of a horizontal movement between two surveys is 0.04 feet at the 95% confidence level, or about 1.2 cm. The estimated vertical uncertainty is about 0.05 to 0.10 feet in the survey addenda. And it sets a rule: if a computed movement is less than that level, "movement is statistically indeterminate."
The report's own rates are consistent with the City's. It gives the average in feet per month, mostly rounded to 0.1 ft. Converted, 0.6 ft/month in early January is about 1.66 inches per week, the City's January figure. The 0.47 ft/month in early May is about 1.30, and the 0.4 in early August is about 1.10, against the City's 0.99. That gap is within the report's rounding. The September 3 survey, newer than the City's last update, averaged 0.3 ft/month for points above the error, or about 0.8 inches per week.
Figure 1 plots what that rule produces. For each survey interval, it shows the report's average movement, next to the 0.04 ft line.

Two things stand out.
First, the average point that is moving clears its error by a wide margin. The average bar is 6 to 18 times the 0.04 ft line, depending on the interval. This is arithmetic on the report's own rounded values, so treat the range as approximate.
Second, the bottom panel shows that about half of the points do not clear it. In each full survey from October 2025 to September 2026, 51 to 57 of 99 to 102 points showed movement above the confidence level. The report does not say how many of the rest sit just under the line. The City says the Klondike Canyon slide shows no measurable movement, so some are likely stable. For a point near the line, though, "no movement detected" and "not moving" are different statements.
The City's geologist put it plainly in April 2024. The highest points on the slide "do not look like they're moving significantly, they're right on the edge of sort of the error range of the survey" (Mike Phipps, city geologist, RPV Landslide Town Hall, 4/17/24). A monitoring program reaches that point as the rate drops.
The rule: signal over noise
The test is the same for any survey method.
- Pick the interval between two epochs.
- Multiply the rate by the interval to get the expected movement (the signal).
- Compare it with the 95% error of a difference between two epochs (the noise).
- If the signal is not clearly larger, you cannot say the point moved.
The City's report already gives the noise for GPS: 0.04 ft, or 0.48 inches. At 0.81 inches per week, Portuguese Bend moves that far in about 0.6 weeks. A monthly interval clears the line more than seven times over (0.81 in/week x 4.3 weeks = 3.5 in, against 0.48 in). GPS monuments can resolve today's rate in under a week.
The interval needed grows as the rate falls. At 12 inches a week, 0.48 inches takes under a day. At 0.1 inch per week, it takes almost five weeks.
The same arithmetic for lidar
A repeat lidar survey adds a second kind of information, and a larger error. Here is the arithmetic for converting a stated lidar error into a detection time. These steps are this post's own arithmetic, not a published method, and the assumptions below matter.
The conversion. If each epoch has an independent, unbiased error with standard deviation s, the difference between two epochs has standard deviation s times the square root of 2. A 95% two-sided threshold is 1.96 times that, or about 2.77 times s. Treat RMSE as an estimate of s.
The inputs. Three error values are in the public record.
- DJI specifies the Zenmuse L2 system at 4 cm vertical and 5 cm horizontal at 150 m, measured in a DJI laboratory. That is a spec, not a field result.
- An independent test found a root mean square error of 0.07 m on an open road and 0.21 m at forest checkpoints under canopy with an L2 (Tamimi and Toth, ISPRS Archives, 2024). Those are vertical errors against surveyed checkpoints.
- The City's GPS figure above.
Read the lidar rows as stand-ins. The Tamimi and Toth values are vertical RMSE, and the DJI value is a lab spec. This post uses them as stand-ins for the error of a horizontal displacement between two epochs, which is what the City's rates measure. None of these sources reports that horizontal displacement error for lidar directly.
The table shows the threshold each implies, and how many days of movement it takes to exceed that threshold at the City's August 2026 rates.
| Error input | 95% change threshold | Days at 0.81 in/wk | Days at 0.99 in/wk | Days at 1.29 in/wk |
|---|---|---|---|---|
| GPS monuments, City report (0.04 ft) | 1.2 cm | 4 | 3 | 3 |
| Lidar at 5 cm (L2 spec, horizontal, lab) | 13.9 cm | 47 | 39 | 30 |
| Lidar at 7 cm vertical RMSE (open road) | 19.4 cm | 66 | 54 | 42 |
| Lidar at 21 cm vertical RMSE (forest canopy) | 58.2 cm | 198 | 162 | 124 |
Figure 2 draws the same curves across rates, including the 2024 peak.

At about 1 inch per week, a lidar workflow with L2-spec-level error needs five to six weeks between epochs before a point's movement is clearly above noise. An error like the open-road result needs about eight weeks. An error like the canopy result needs about 23 weeks, roughly a season. At the 2024 peak of nearly 12 inches per week, even the canopy case clears in about two weeks.
What the assumptions hide
- Errors are not always independent. If both epochs share the same control, much of any bias cancels in the difference. That makes the real threshold lower than the chart for a well-controlled pair, and higher for a pair on different control or datums. This is an inference, so test it with checkpoints.
- The Tamimi and Toth numbers are vertical, and the City's rates are horizontal. A slide that translates mostly sideways raises or lowers the surface less than it moves. Elevation differencing sees only part of the motion. Measuring horizontal displacement from point clouds needs feature or surface matching, and its error is not the same as the vertical RMSE. Use the chart as a scale, not a promise.
- The 21 cm figure is for forest. It is not a number for coastal scrub or chaparral.
- Averaging helps and the chart ignores it. Comparing many points or a surface patch shrinks random error. Bias does not.
None of this makes lidar the wrong tool. It means the error budget, measured on your site, should set the interval.
What monuments miss between them
If GPS is so much more precise, why fly anything? Because monuments are points.
About 100 monuments sample a slide complex that is moving in patches. In April 2024 the city geologist said they were surveying "about every six weeks". The surveyor's report says the program then went to monthly and weekly surveys as movement accelerated. A monument says nothing about the ground between it and its neighbors: a new scarp, a fissure that opens a path for storm water, or a toe that advances.
A peer view makes the same point from the satellite side. Casey Jones, a PE who comments publicly on the slide, noted that when displacement between overflights is large, "you can miss some of the movement" and underpredict the total. For one 2024 period, he said the City's study showed about 8 inches of movement where JPL radar showed about 4. He also said he did not know whether there had been enough instrumentation across the slide to get a handle on the risk. He is a commentator, not the City, and these are his words, not verified findings.
Public lidar shows what area coverage looks like. Figure 3 differences two USGS 3DEP bare-earth DEMs of the Portuguese Bend and Abalone Cove area: one from lidar collected September 2015 to October 2016, and one from January 2023 to January 2024.

In this 2.5 by 1.6 km window, about 28 hectares rose by more than 1 m and about 9 hectares dropped by more than 1 m between the two collections. About 2 hectares rose by more than 3 m. These are tallies from the two public DEMs, computed in build_figures.py.
Do not read the map as a landslide boundary. The differences include slide movement, but also grading, construction, vegetation classification and differences between the two projects' processing. This post did not review the vertical accuracy statements for either DEM project, so the figure shows a pattern, not a calibrated measurement of movement. The point is coverage: about seven years of change appears as a surface across tens of hectares, which 100 monuments cannot draw.
The practical combination: monuments carry the precision, and the surface carries the coverage and shows where to put the next monument or boring. The speaker in a Vancouver Geotechnical Society talk on lidar and slope instability put it well: "lidar is a tool, we have lots of tools but tools are not always the solution". Nothing here argues that lidar replaces GPS monuments, inclinometers or radar.
What to ask for before a repeat survey
Use these to scope a monitoring survey, whoever does it.
- The error in the same terms as the movement. Ask for a 95% error on a two-epoch difference, in the direction you care about (horizontal, vertical or 3D). The City's report does this.
- Independent checkpoints, reported per surface type. The ASPRS Positional Accuracy Standards, Edition 2 call for no fewer than 30 checkpoints for vertical accuracy assessment, and say vegetated vertical accuracy should be tested and reported as found. Ask for RMSE, not a single "accuracy" figure, and for vegetated and open results separately.
- A fixed reference frame and the same control. The City's surveyor keeps NAD83 (2007) Epoch 2007.00 on purpose, even though NAD83 (2011) Epoch 2010.00 is available, so positions stay comparable with the 2007 start. The report also documents its move from the Geoid03 to the Geoid18 model for elevations. An unrecorded frame, epoch or geoid change between surveys can look like movement. Pick a frame, keep it, and document any change.
- Stable points off the slide in every epoch. The City report occupies five reference points outside the active zone and lists their residuals each time. Do the same for any aerial epoch.
- An interval chosen from the error budget. Use the rule above. If your rate times your interval does not clearly beat your threshold, either wait longer or tighten the error.
- Wording for what is below the line. Ask that results report "not detected" for points under the threshold, never "zero," so a reader cannot mistake low resolution for stability.
- Epochs timed to the season. The City geologist believes early-season rainfall drove a re-acceleration in early 2026. A pre-season baseline and a post-storm epoch make a clean pair.
Who has to sign
In California, the Board for Professional Engineers, Land Surveyors, and Geologists says in Bulletin 50 that flight planning, piloting and capturing photos are not regulated by the Professional Land Surveyors' Act. Creating a topographic survey, or an orthorectified map, for a client or public agency is. That work needs a licensee in responsible charge: a PLS or, in California, a civil engineer legally authorized to practice land surveying. The City's monitoring surveys are performed under the direction of a PLS.
Twinn Digital captures and processes data. It rents equipment for each job and is not tied to one sensor. Flights are planned with software agents and flown by a human FAA Part 107 remote pilot, and the work is insured for $2 million. Twinn does not stamp. A licensed partner reviews and signs what goes to an agency or into a permit.
If grant money is involved, check the funding terms before choosing a sensor. The City has applied for several federal grants for landslide mitigation. Federal drone rules turn on funding and operation, and the rules for drones from certain foreign manufacturers have changed. Check SAM.gov and your grant terms for current covered-entity status instead of assuming either way.
One practical next step
Before the next storm season, write down three numbers for your slope: the rate you expect, the interval between epochs, and the 95% error of a two-epoch difference for the method you plan to use. Multiply the rate by the interval, then divide by the error. If the result is not clearly above 1, you cannot say a point moved. The monthly GPS example above comes out at about 7.
Then ask your surveyor which monuments, checkpoints and datum the next epoch will reuse, so an aerial surface ties to the data you already hold.
To plan a capture and processing job with a licensed partner for slope or landslide monitoring, see Twinn Digital for slope monitoring.