Ten years of rock left? What California's 2026 aggregate report says about SoCal permitted reserves
November 6, 2026
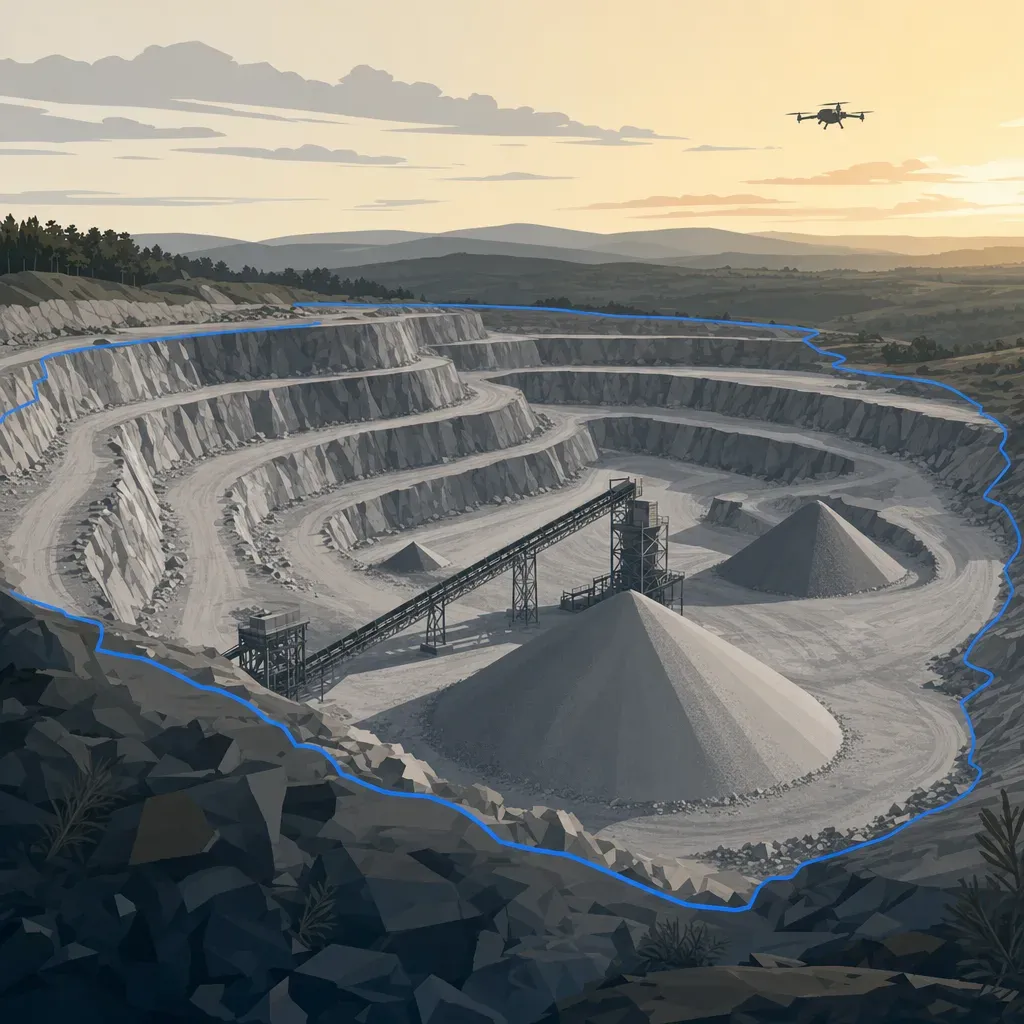
In 2026 the California Geological Survey (CGS) updated Map Sheet 52, its statewide comparison of permitted aggregate reserves against 50 years of forecast demand. Two regions came out in the lowest band: San Bernardino and the San Fernando Valley-Saugus Newhall area. Both have 10 or fewer years of permitted reserves.
This post walks through what the Supplement to Map Sheet 52 says, where the "years remaining" number comes from, and why its edges are softer than they look. Then it turns to the part a pit owner controls: the survey behind your own reserve figure.
What the report measures
Map Sheet 52 compares two numbers for each "aggregate study area." Most areas are production-consumption (P-C) regions: one or more producing mines plus the market they serve. A P-C region can cross county lines.
- Permitted reserves. Per CGS, these are aggregate deposits "suitable for commercial use" that sit on land owned or leased by producers and are authorized for mining under valid permits. A lead agency such as a county or city issues the permit.
- 50-year demand. Forecast tons needed from January 1, 2024 through December 2073.
- Years of permitted reserves remaining. Reported only in bands: 10 or fewer, 11 to 20, 21 to 30, 31 to 40, 41 to 50, and more than 50.
Three limits matter before you quote it.
- The data are dated. Reserves are "as of January 1, 2024." CGS says the estimates do not reflect later production, closures or new permits.
- It is a planning overview. CGS says the information "should not be used as the basis for local land-use decisions." Local decisions should rely on the individual aggregate studies behind the map.
- Construction aggregate only. The study counts sand, gravel and crushed stone that meet specifications for portland cement concrete or asphalt. It is not every ton a pit sells.
The statewide totals are close. The 24 study areas hold about 7.2 billion tons of permitted reserves and are forecast to need about 8.0 billion tons over 50 years. Seventeen of the 24 have reserves smaller than their 50-year demand (counted from Table 1).

The Southern California regions
Here are the ten Southern California regions grouped here from Table 1, with the band CGS assigned in the 2018 and 2026 editions. Reserves and demand are in million tons. The 2018 bands come from the 2018 Supplement, which used conditions as of January 1, 2017.
One caveat before comparing editions: the methods changed. Per the 2026 Supplement, the 2018 edition used population projections based on the 2010 Census, and the 2026 edition uses projections based on the 2020 Census. Some regions also changed demand method or boundary. So a band change mixes real depletion with new inputs. It is not a clean like-for-like measurement.
| Region | Reserves 2026 | 50-yr demand 2026 | Band 2018 | Band 2026 |
|---|---|---|---|---|
| San Fernando Valley-Saugus Newhall | 9 | 754 | 10 or fewer | 10 or fewer |
| San Bernardino | 133 | 636 | 11 to 20 | 10 or fewer |
| Claremont-Upland | 48 | 163 | 21 to 30 | 11 to 20 |
| Palmdale | 120 | 537 | 11 to 20 | 11 to 20 |
| San Gabriel Valley | 240 | 512 | 21 to 30 | 11 to 20 |
| Western San Diego County | 224 | 374 | 11 to 20 | 21 to 30 |
| Western Ventura-Simi | 104 | 106 | 11 to 20 | 41 to 50 |
| Palm Springs | 175 | 174 | 31 to 40 | More than 50 |
| Barstow-Victorville | 118 | 101 | 31 to 40 | More than 50 |
| Temescal Valley-Orange County | 861 | 836 | 41 to 50 | More than 50 |
San Fernando Valley-Saugus Newhall was already in the lowest band in 2018, with 17 million tons. It now has 9. San Bernardino is the change: it moved from the 11-to-20 band to 10 or fewer, under the new data and forecasts. Western Ventura-Simi was called "Ventura County" in 2018, and its 2026 boundary takes in a small slice of Los Angeles County.
Figure 2 shows how reserves and demand moved between editions.

Read three things from it.
- Reserves fell in six of the ten regions, each by 15% or more. CGS says most decreases come from production, and some from mines closed and reclaimed before their permitted resource was used up.
- Three regions gained reserves from new or expanded permits: Ventura-Simi (up 24%), Palm Springs (up 7%) and Barstow-Victorville (up 1%). Temescal Valley-Orange County was flat (861 versus 862).
- Demand forecasts fell in nine of the ten. CGS says the drop is "likely due in part to reduced overall construction, increased aggregate recycling, and updated population forecasts." The exception is San Fernando Valley-Saugus Newhall, where the forecast nearly doubled (up 95%). CGS also switched that region to a statewide per-capita demand method (Table 2).
The last point deserves a flag. The forecast method changed for that region, so its 2018 and 2026 demand figures are not like for like.
Why "10 or fewer" is a soft edge
It is tempting to divide reserves by 50-year demand over 50 and call the answer the years left. That is not CGS's method. The 2026 Supplement says the years are calculated by comparing reserves "with projected annual aggregate consumption on a year-by-year basis." The 2018 edition adds that this "is not the same as dividing the total projected 50-year demand for aggregate by 50."
Here is that shortcut anyway, as Twinn Digital's own check, to show why it misleads. For San Bernardino in 2026:
- Average annual demand is 636 / 50 = 12.7 million tons.
- 133 million tons of reserves / 12.7 = 10.5 years at that flat average.
- The official band is 10 or fewer.
Now the 2018 edition, using the same shortcut: 156 million tons of reserves and 939 million tons of demand gives 156 / 18.8 = 8.3 years. CGS's published band for that edition was 11 to 20 years. The shortcut was off in the other direction.
Both checks are Twinn Digital's arithmetic, not CGS results, and the two editions used different inputs. Twinn Digital reads this to mean the band depends on the shape of the annual demand curve, which the Supplement does not print, so the band cannot be reproduced from the published tables. One possible reason for the 2026 gap, also an inference: CGS says updated forecasts show slower population growth or even declines. Demand that is higher early in the window would run reserves down sooner than a flat average.
Treat the bands as a ranking, not a countdown. CGS says the ranges have "uncertainties that are not quantified." It lists strong economic growth, major infrastructure projects and post-disaster rebuilding as things that would speed depletion. New or expanded permits could extend it.
Neighboring regions also matter. CGS says importing aggregate from neighboring regions can speed depletion in the regions that supply it. It also says haul distances that were 20 to 30 miles one way decades ago are now sometimes 100 miles or more.
Where a reserve number comes from
For this edition CGS updated reserves through what it calls "an extensive review of SMARA mine files." That review used lead-agency-approved reclamation plans, mining plans and use permits. It subtracted production reported to the Department of Conservation's Division of Mine Reclamation (DMR) for 2017 through 2023.
Operators must report calendar-year production to DMR by July 1 of the following year. Per CGS, not every report arrives on time, and the 2023 production data was not available until the beginning of 2025.
So the regional number is built from paper that starts with each operator: permit limits, approved plans and annual production. Your pit's reserve figure feeds that chain, and its quality is something you can improve.
Three honest limits apply to what a survey adds.
- A survey measures the surface, not the deposit. Reserves also depend on thickness, quality and what the permit allows you to mine. A drone survey says nothing about material below the ground. The Supplement's authorship page lists its author as a Professional Geologist (PG).
- Volume is not tons. Operators convert with density, moisture and loose-versus-bank factors. John Scepaniak, a North Dakota crushing contractor, put it this way on a podcast: "what is the conversion on tonnage the yardage ... the volume depends what you're making how much air is in the pile how much did it rain ... that gets real messy."
- The permit line is the real boundary. A reserve is the volume between today's surface and the permitted final design, inside the permit limit. If your survey and your permit exhibits are on different datums, the reserve figure inherits the mismatch.
An illustrative worked example (invented numbers)
This example is illustrative only. "Example Aggregate Pit" is not a real site, and every number below is made up, including the density, which you would replace with your own.
- Two surveys a year apart, each over a 40-acre active area (161,874 m²).
- Each survey has a vertical RMSE of 5 cm.
- Annual production from scale records: 600,000 tons.
- Permitted reserve: 10 million tons.
For one point, the uncertainty of a difference of two surfaces with equal, independent RMSE is 1.414 times the RMSE. A conservative case for volume treats that error as an offset shared across the whole area, so the volume bound is 1.414 x RMSE x area.
- 1.414 x 0.05 m x 161,874 m² = about 11,450 m³, or about 14,970 cubic yards.
- At an assumed 1.6 tons per cubic meter, that is about 18,300 tons.
That is 3% of a year's production and 0.18% of the permitted reserve. Against San Bernardino's 133 million tons it is about 0.014%.
Three lessons follow.
- Survey error is rarely what moves a reserve. Density assumptions, the final-grade surface and the permit limit usually matter more.
- It does matter if you back out density. If you reconcile survey volume against scale tons to get a tons-per-yard factor, a bias in the volume goes straight into that factor.
- Bias is the number to manage. Random noise averages down across a large pit. A control or datum offset does not. Use the same control and datum both years, and say so in the report.
This illustrative example is Twinn Digital's own arithmetic, not data from any pit. It assumes equal errors on both surfaces and ignores any control shared between the two surveys, which would lower the real figure.
What accuracy to expect, and from what
Quote a number only with its conditions.
- DJI specifies the Zenmuse L2 system at 4 cm vertical and 5 cm horizontal at 150 m, measured in a DJI laboratory environment. A sensor such as the L2 is one example; flights can use whatever equipment suits the job.
- An independent test, Tamimi and Toth (ISPRS Archives, 2024), found 0.07 m RMSE on an open road and 0.21 m under dense canopy for an L2.
- ASPRS Positional Accuracy Standards, Edition 2 report vertical accuracy as RMSE and call for at least 30 checkpoints. They say vegetated vertical accuracy should be "evaluated and reported" rather than used as a pass-or-fail criterion.
In a pit, ask for RMSEv on independent checkpoints from bare floor, bench tops and haul roads, with the count. Report loose stockpiles and vegetated overburden slopes separately. On steep faces a small horizontal error becomes a larger vertical one. That is general geometry, not a sourced figure, so ask how the faces were handled.
What the state mine database shows
The DMR All Mines layer is the public list of SMARA-reported mines. Figure 3 counts mines whose primary product is sand and gravel, stone or rock and whose status is active, idle or newly permitted, in six Southern California counties.

Read it with care. The data are reported by operators in annual reports, and DMR says it "cannot guarantee the accuracy of operator-reported location information." A county is not a P-C region, and these mines include material that is not concrete or asphalt grade. Use it to find who sits in your lead agency's file, not to rebuild CGS's reserves.
Of the 106 mines plotted, 98% have a 2025 report year, so the layer reflects recent annual reports.
Who signs what
A topographic surface and volumes delivered for a permit submittal are land surveying under California law. Business and Professions Code 8726 covers anyone who "determines the configuration or contour of the earth's surface." The Board's Bulletin 50 says flight planning, piloting and capturing images are not themselves regulated, but creating a topographic survey for a client or public agency is.
That work needs a licensee in responsible charge: a PLS or, in California, a civil engineer legally authorized to practice land surveying. A geologic reserve estimate is a different discipline, so ask who on your team signs which piece.
Twinn Digital does not stamp. It captures and processes the data. Flights are planned with software agents and flown by a human FAA Part 107 remote pilot, on equipment rented for the job, and the work is insured for $2 million. A licensed partner reviews and stamps anything that goes into a submittal.
What operators say about "permitted reserves"
The people who run pits talk about this in practical terms. Robert Dugan, speaking on the Between Two Shovels podcast about California construction-materials costs, says "our permitted reserves are looking good" while discussing flattening demand. Earlier in the same episode he says the state "just came out with a new map sheet 52."
The CGS tables fit that for some regions: seven of 24 study areas have more than 50 years. For San Bernardino and the San Fernando Valley, they do not.
Scepaniak describes the reserve question as a bid-time question: "it's december 16th we're quoting work how much is up in the johnson pit for rock what's all left in there we want to know if we can bid a job out of it." His answer was an up-to-date surface he could pull when the question came.
One practical next step
Before your next survey, pull four things from your engineer or consultant:
- The permit limit and final design surface, with their datum.
- Last year's survey surface and the control used.
- The P-C region or county study CGS lists for your site, from the Map Sheet 52 appendix.
- The density and moisture factors behind last year's tons figure.
Then settle in writing whether the new survey ties to the same control, who reports RMSEv from independent checkpoints, and how you will reconcile survey volume with scale tons. Those answers decide how much of your reserve number rests on measurement and how much on assumption.
To plan a pit capture and processing job with a licensed partner stamping the deliverable, see Twinn Digital for mines and aggregates.